

3. Global Terrestrial Gross and Net Primary Productivity from the Earth Observing System
53
uses maximum leaf mass and the leaf longevity to
assess leaf growth respiration, and then uses empirical coefficients to relate annual leaf growth respiration costs to fine root, live wood, and deadwood
growth respiration. These parameters are calculated
directly from similar parameters used in the
BIOME-BGC model.
Availability and Retrieval of Global
NPP Data
The final global NPP computed every 8 days will
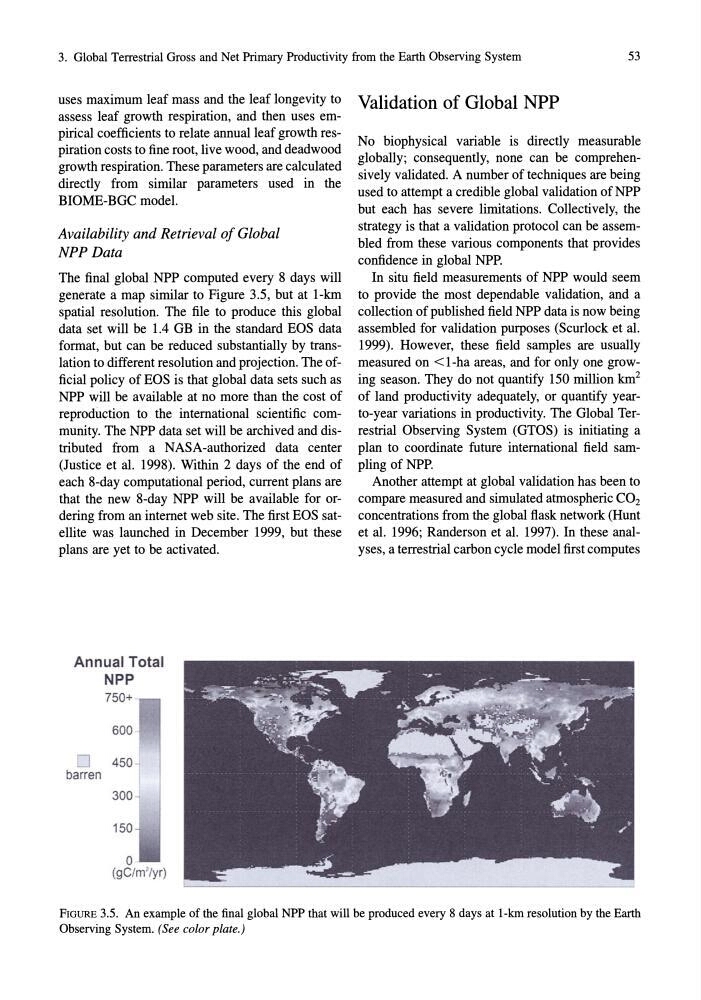
generate a map similar to Figure 3.5, but at l-km
spatial resolution. The file to produce this global
data set will be 1.4 GB in the standard EOS data
format, but can be reduced substantially by translation to different resolution and projection. The official policy of EOS is that global data sets such as
NPP will be available at no more than the cost of
reproduction to the international scientific community. The NPP data set will be archived and distributed from a NASA-authorized data center
(Justice et al. 1998). Within 2 days of the end of
each 8-day computational period, current plans are
that the new 8-day NPP will be available for ordering from an internet web site. The first EOS satellite was launched in December 1999, but these
plans are yet to be activated.
Annual Total
NPP
750+
600
o 450 -
barren
300 ~
150
o
(gC/m 'l yr)
Validation of Global NPP
No biophysical variable is directly measurable
globally; consequently, none can be comprehensively validated. A number of techniques are being
used to attempt a credible global validation of NPP
but each has severe limitations. Collectively, the
strategy is that a validation protocol can be assembled from these various components that provides
confidence in global NPP.
In situ field measurements of NPP would seem
to provide the most dependable validation, and a
collection of published field NPP data is now being
assembled for validation purposes (Scurlock et al.
1999). However, these field samples are usually
measured on < I-ha areas, and for only one growing season. They do not quantify 150 million km 2
of land productivity adequately, or quantify yearto-year variations in productivity. The Global Terrestrial Observing System (GTOS) is initiating a
plan to coordinate future international field sampling of NPP.
Another attempt at global validation has been to
compare measured and simulated atmospheric CO 2
concentrations from the global flask network (Hunt
et al. 1996; Randerson et al. 1997). In these analyses, a terrestrial carbon cycle model first computes
FIGURE 3.5. An example of the final global NPP that will be produced every 8 days at I-kIn resolution by the Earth
Observing System. (See color plate.)
53
uses maximum leaf mass and the leaf longevity to
assess leaf growth respiration, and then uses empirical coefficients to relate annual leaf growth respiration costs to fine root, live wood, and deadwood
growth respiration. These parameters are calculated
directly from similar parameters used in the
BIOME-BGC model.
Availability and Retrieval of Global
NPP Data
The final global NPP computed every 8 days will
generate a map similar to Figure 3.5, but at l-km
spatial resolution. The file to produce this global
data set will be 1.4 GB in the standard EOS data
format, but can be reduced substantially by translation to different resolution and projection. The official policy of EOS is that global data sets such as
NPP will be available at no more than the cost of
reproduction to the international scientific community. The NPP data set will be archived and distributed from a NASA-authorized data center
(Justice et al. 1998). Within 2 days of the end of
each 8-day computational period, current plans are
that the new 8-day NPP will be available for ordering from an internet web site. The first EOS satellite was launched in December 1999, but these
plans are yet to be activated.
Annual Total
NPP
750+
600
o 450 -
barren
300 ~
150
o
(gC/m 'l yr)
Validation of Global NPP
No biophysical variable is directly measurable
globally; consequently, none can be comprehensively validated. A number of techniques are being
used to attempt a credible global validation of NPP
but each has severe limitations. Collectively, the
strategy is that a validation protocol can be assembled from these various components that provides
confidence in global NPP.
In situ field measurements of NPP would seem
to provide the most dependable validation, and a
collection of published field NPP data is now being
assembled for validation purposes (Scurlock et al.
1999). However, these field samples are usually
measured on < I-ha areas, and for only one growing season. They do not quantify 150 million km 2
of land productivity adequately, or quantify yearto-year variations in productivity. The Global Terrestrial Observing System (GTOS) is initiating a
plan to coordinate future international field sampling of NPP.
Another attempt at global validation has been to
compare measured and simulated atmospheric CO 2
concentrations from the global flask network (Hunt
et al. 1996; Randerson et al. 1997). In these analyses, a terrestrial carbon cycle model first computes
FIGURE 3.5. An example of the final global NPP that will be produced every 8 days at I-kIn resolution by the Earth
Observing System. (See color plate.)