

392
®
% Maximum Growth Rate
25
50
75
100
'600 -r----'---'--......L--!
U
1'200
~ BOO
o . .
.!!
.2400
•
~
o r---1 P-limited Growth~
u
'E ' 20
I
~
80
Z
..
~ 40
~
@
0;
oE
'5
Ii:"
10
~
~
'"
.~
e
~
. .
:;
O
'ii
100
50
Q.~
z·. 30
~
0.2
0.4
0.6
O.S
1.0
Specific Growth Rate (d- 1 )
o 0.2 0.4 0.6 0.8 1.0 1.2
Specific Growth Rate (d- 1 )
©
:§:
:§:
9>
~
' "
c: e
I!!
{l
''0' .£!
~""
.S ~S
t
.Q
.~ ~"
o I!! .g
.2 e " ~
~ ~~ ' "
<:(
I
I
o
7 910 12
% Maximum Growth Rate
25
50
75
'00
' 40 + __ L-_......L _ _ ...L.._--I
:2
1'20 J--------. ..M.~.,....""
~
. / .
o 80 • •
e. -.-'t' -.
; ; ; ·-·'e· ... :- .. ·
:; 40
•
~
N-limited Growthl--. F- ••
.. ... ",.
: .. --"""""'-; ... .
.. -.. ~
1.0
2.0
3.0
Specific Growth Rate (d-')
(no relationships)
o 0.2 0.4 0.6 0.8 1.0 1.2
Specific Growth Rate (d- 1 )
:§
:§: E
§
'" .a :§:
.a "
~
' " § .!!/
.Q
'"
f
ol!! .g c:
~
~
~ .s
'"
~
§
"
E
~
{l .s
.g
' "
.~
{l
' " ' "
' "
~
c: '5,
c:
.9l ~
~
<:(
~
I
21 23 25
30
Optimum N:P Ratios
James J. Elser
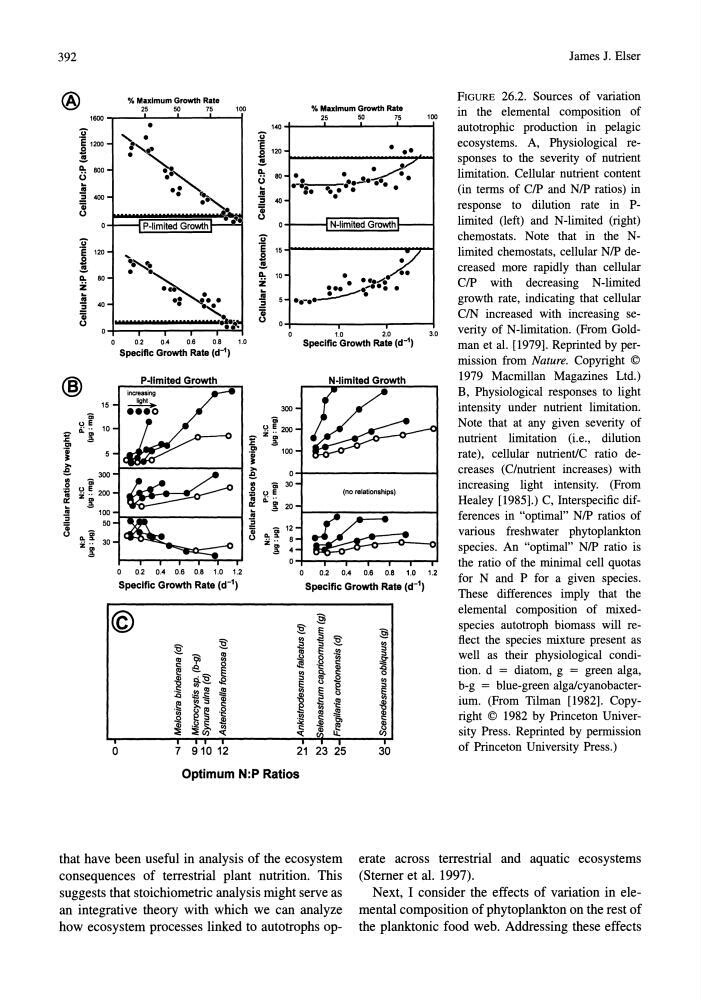
FIGURE 26.2. Sources of variation
in the elemental composition of
autotrophic production in pelagic
ecosystems. A, Physiological responses to the severity of nutrient
limitation. Cellular nutrient content
(in terms of CIP and NIP ratios) in
response to dilution rate in Plimited (left) and N-limited (right)
chemostats. Note that in the Nlimited chemostats, cellular NIP decreased more rapidly than cellular
CIP with decreasing N-limited
growth rate, indicating that cellular
C/N increased with increasing severity of N-limitation. (From Goldman et al. [1979]. Reprinted by permission from Nature. Copyright ©
1979 Macmillan Magazines Ltd.)
B, Physiological responses to light
intensity under nutrient limitation.
Note that at any given severity of
nutrient limitation (i.e., dilution
rate), cellular nutrientlC ratio decreases (C/nutrient increases) with
increasing light intensity. (From
Healey [1985].) C, Interspecific differences in "optimal" NIP ratios of
various freshwater phytoplankton
species. An "optimal" NIP ratio is
the ratio of the minimal cell quotas
for N and P for a given species.
These differences imply that the
elemental composition of mixedspecies autotroph biomass will reflect the species mixture present as
well as their physiological condition. d = diatom, g = green alga,
b-g = blue-green alga/cyanobacterium. (From Tilman [1982]. Copyright © 1982 by Princeton University Press. Reprinted by permission
of Princeton University Press.)
that have been useful in analysis of the ecosystem
consequences of terrestrial plant nutrition. This
suggests that stoichiometric analysis might serve as
an integrative theory with which we can analyze
how ecosystem processes linked to autotrophs operate across terrestrial and aquatic ecosystems
(Sterner et al. 1997).
Next, I consider the effects of variation in elemental composition of phytoplankton on the rest of
the planktonic food web. Addressing these effects
®
% Maximum Growth Rate
25
50
75
100
'600 -r----'---'--......L--!
U
1'200
~ BOO
o . .
.!!
.2400
•
~
o r---1 P-limited Growth~
u
'E ' 20
I
~
80
Z
..
~ 40
~
@
0;
oE
'5
Ii:"
10
~
~
'"
.~
e
~
. .
:;
O
'ii
100
50
Q.~
z·. 30
~
0.2
0.4
0.6
O.S
1.0
Specific Growth Rate (d- 1 )
o 0.2 0.4 0.6 0.8 1.0 1.2
Specific Growth Rate (d- 1 )
©
:§:
:§:
9>
~
' "
c: e
I!!
{l
''0' .£!
~""
.S ~S
t
.Q
.~ ~"
o I!! .g
.2 e " ~
~ ~~ ' "
<:(
I
I
o
7 910 12
% Maximum Growth Rate
25
50
75
'00
' 40 + __ L-_......L _ _ ...L.._--I
:2
1'20 J--------. ..M.~.,....""
~
. / .
o 80 • •
e. -.-'t' -.
; ; ; ·-·'e· ... :- .. ·
:; 40
•
~
N-limited Growthl--. F- ••
.. ... ",.
: .. --"""""'-; ... .
.. -.. ~
1.0
2.0
3.0
Specific Growth Rate (d-')
(no relationships)
o 0.2 0.4 0.6 0.8 1.0 1.2
Specific Growth Rate (d- 1 )
:§
:§: E
§
'" .a :§:
.a "
~
' " § .!!/
.Q
'"
f
ol!! .g c:
~
~
~ .s
'"
~
§
"
E
~
{l .s
.g
' "
.~
{l
' " ' "
' "
~
c: '5,
c:
.9l ~
~
<:(
~
I
21 23 25
30
Optimum N:P Ratios
James J. Elser
FIGURE 26.2. Sources of variation
in the elemental composition of
autotrophic production in pelagic
ecosystems. A, Physiological responses to the severity of nutrient
limitation. Cellular nutrient content
(in terms of CIP and NIP ratios) in
response to dilution rate in Plimited (left) and N-limited (right)
chemostats. Note that in the Nlimited chemostats, cellular NIP decreased more rapidly than cellular
CIP with decreasing N-limited
growth rate, indicating that cellular
C/N increased with increasing severity of N-limitation. (From Goldman et al. [1979]. Reprinted by permission from Nature. Copyright ©
1979 Macmillan Magazines Ltd.)
B, Physiological responses to light
intensity under nutrient limitation.
Note that at any given severity of
nutrient limitation (i.e., dilution
rate), cellular nutrientlC ratio decreases (C/nutrient increases) with
increasing light intensity. (From
Healey [1985].) C, Interspecific differences in "optimal" NIP ratios of
various freshwater phytoplankton
species. An "optimal" NIP ratio is
the ratio of the minimal cell quotas
for N and P for a given species.
These differences imply that the
elemental composition of mixedspecies autotroph biomass will reflect the species mixture present as
well as their physiological condition. d = diatom, g = green alga,
b-g = blue-green alga/cyanobacterium. (From Tilman [1982]. Copyright © 1982 by Princeton University Press. Reprinted by permission
of Princeton University Press.)
that have been useful in analysis of the ecosystem
consequences of terrestrial plant nutrition. This
suggests that stoichiometric analysis might serve as
an integrative theory with which we can analyze
how ecosystem processes linked to autotrophs operate across terrestrial and aquatic ecosystems
(Sterner et al. 1997).
Next, I consider the effects of variation in elemental composition of phytoplankton on the rest of
the planktonic food web. Addressing these effects