

22. Assessing the Effects of Acidification on Aquatic Ecosystems: Insights from Lake Experiments
335
absorbance (Schindler et al. 1996; Williamson et
al. 1996; Yan et al. 1996a), as well as the fundamental interactions within a lake's food web mentioned earlier (Webster et al. 1992).
Acidification experiments must also consider
the time necessary for the full range of chemical
and biological effects to propagate through an ecosystem. For example, adult fishes have been shown
to be relatively immune to acid effects while
younger fishes (less than one year of age) are more
sensitive. Effects on adult fish populations would
only be detectable after a time period close to the
life span of fishes, requiring an extended treatment
period to detect the effects of changing fish populations (Schindler et al. 1985; Eaton et al. 1992).
Such fish changes might be anticipated to have
major consequences on a wide range of limnological features (Carpenter and Kitchell 1993). The
degree of changes in chemical features have been
shown to increase over the course of a pH manipulation to a certain level (Brezonik et al. 1993). It
seems unlikely that the whole-lake experiments
that have been conducted have been carried out
for a long enough time that all acid responses have
had an opportunity to reach their culmination.
Longer experiments seem likely to exhibit a wider
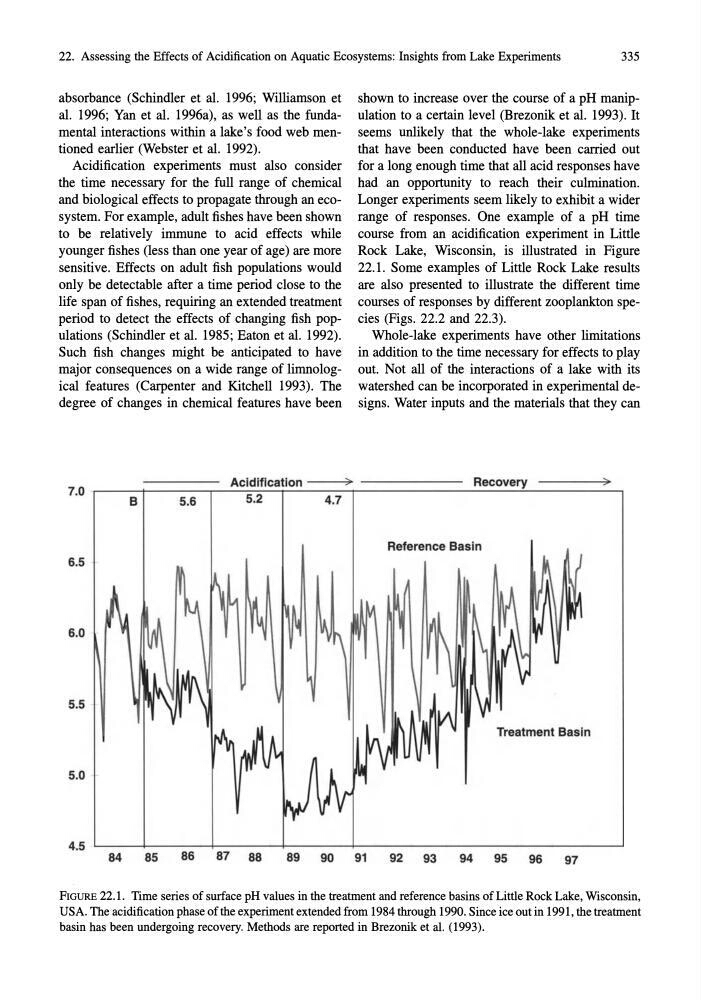
range of responses. One example of a pH time
course from an acidification experiment in Little
Rock Lake, Wisconsin, is illustrated in Figure
22.l. Some examples of Little Rock Lake results
are also presented to illustrate the different time
courses of responses by different zooplankton species (Figs. 22.2 and 22.3).
Whole-lake experiments have other limitations
in addition to the time necessary for effects to play
out. Not all of the interactions of a lake with its
watershed can be incorporated in experimental designs. Water inputs and the materials that they can
7.0
Recovery
Acidification ----;;;..) - - - - - - -
)
B
5.6
5.2
4.7
Reference Basin
6.5
6.0
5.5
Treatment Basin
5.0
4.5
84
85
86
87 88
89
90
91
92 93
94
95
96
97
FIGURE 22.1. Time series of surface pH values in the treatment and reference basins of Little Rock Lake, Wisconsin,
USA. The acidification phase of the experiment extended from 1984 through 1990. Since ice out in 1991, the treatment
basin has been undergoing recovery. Methods are reported in Brezonik et al. (1993).
335
absorbance (Schindler et al. 1996; Williamson et
al. 1996; Yan et al. 1996a), as well as the fundamental interactions within a lake's food web mentioned earlier (Webster et al. 1992).
Acidification experiments must also consider
the time necessary for the full range of chemical
and biological effects to propagate through an ecosystem. For example, adult fishes have been shown
to be relatively immune to acid effects while
younger fishes (less than one year of age) are more
sensitive. Effects on adult fish populations would
only be detectable after a time period close to the
life span of fishes, requiring an extended treatment
period to detect the effects of changing fish populations (Schindler et al. 1985; Eaton et al. 1992).
Such fish changes might be anticipated to have
major consequences on a wide range of limnological features (Carpenter and Kitchell 1993). The
degree of changes in chemical features have been
shown to increase over the course of a pH manipulation to a certain level (Brezonik et al. 1993). It
seems unlikely that the whole-lake experiments
that have been conducted have been carried out
for a long enough time that all acid responses have
had an opportunity to reach their culmination.
Longer experiments seem likely to exhibit a wider
range of responses. One example of a pH time
course from an acidification experiment in Little
Rock Lake, Wisconsin, is illustrated in Figure
22.l. Some examples of Little Rock Lake results
are also presented to illustrate the different time
courses of responses by different zooplankton species (Figs. 22.2 and 22.3).
Whole-lake experiments have other limitations
in addition to the time necessary for effects to play
out. Not all of the interactions of a lake with its
watershed can be incorporated in experimental designs. Water inputs and the materials that they can
7.0
Recovery
Acidification ----;;;..) - - - - - - -
)
B
5.6
5.2
4.7
Reference Basin
6.5
6.0
5.5
Treatment Basin
5.0
4.5
84
85
86
87 88
89
90
91
92 93
94
95
96
97
FIGURE 22.1. Time series of surface pH values in the treatment and reference basins of Little Rock Lake, Wisconsin,
USA. The acidification phase of the experiment extended from 1984 through 1990. Since ice out in 1991, the treatment
basin has been undergoing recovery. Methods are reported in Brezonik et al. (1993).