

272
balance: Dry deposition is calculated as the difference between nutrient outputs (fluxes in throughfall
plus stemflow) and nutrient inputs by wet deposition, again corrected for any change in internal storage (e.g., Lovett 1994). This approach assumes that
leaching of nutrients from tree tissues, and chemical reactions between nutrients supplied by wet
deposition and tree tissues, are negligible. This is
not always the case, as some nutrients are affected
by internal canopy sinks and/or sources within canopies. For example, potassium K + is known to be
released from live leafs and canopy K + budgets can
be significantly compromised by this internal
source.
Nevertheless, canopy mass balances are commonly used as alternative measures of dry deposition to forests. Butler and Likens (1995) adopted
these techniques to estimate dry and total deposition of Sand N to forests near Ithaca, NY. They
found that canopy mass-balance techniques gave
deposition values very similar to more standard inferential deposition velocity techniques used by the
National Dry Deposition Network (now CASiNet).
In contrast, Lovett et al. (1992) found important
differences between inferential and mass-balance
measures of S dry deposition to the Hubbard Brook
Experimental Forest, NH.
While it is more difficult to establish mass balances at the scale of entire watersheds, such efforts
can quantify dry deposition to larger areas within
landscapes. For example, Likens et al. (1990) estimated dry S deposition from a 23-year record of
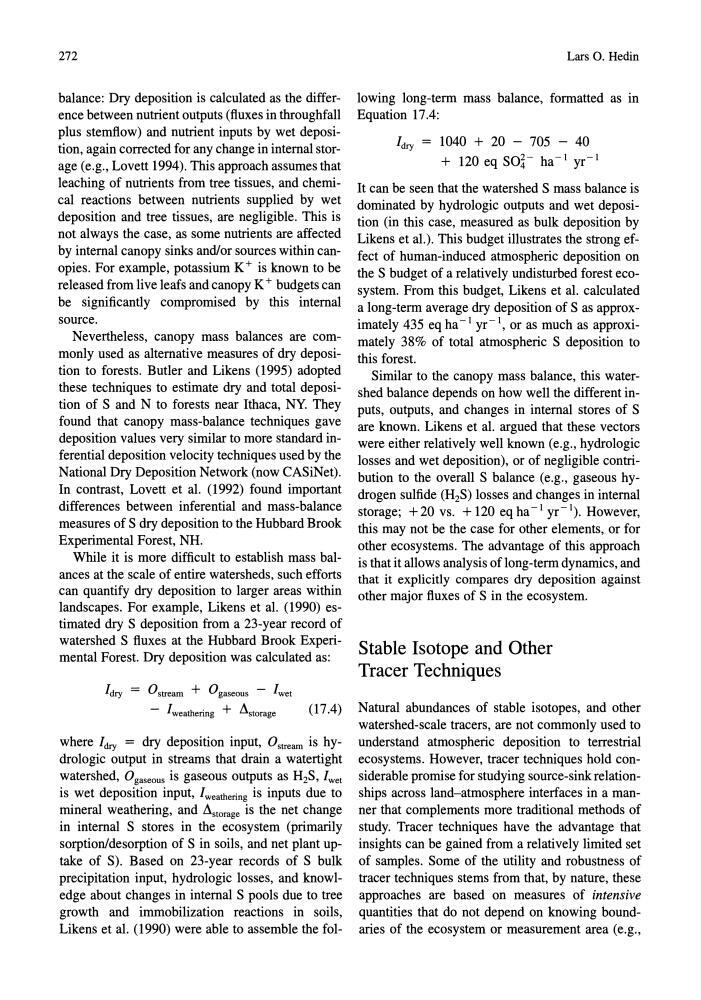
watershed S fluxes at the Hubbard Brook Experimental Forest. Dry deposition was calculated as:
ldry = Ostream + Ogaseous - lwet
- I weathering + Astorage
(17.4)
where ldry = dry deposition input, Ostream is hydrologic output in streams that drain a watertight
watershed, Ogaseous is gaseous outputs as H2S, lwet
is wet deposition input, lweathering is inputs due to
mineral weathering, and Astorage is the net change
in internal S stores in the ecosystem (primarily
sorption/desorption of S in soils, and net plant uptake of S). Based on 23-year records of S bulk
precipitation input, hydrologic losses, and knowledge about changes in internal S pools due to tree
growth and immobilization reactions in soils,
Likens et al. (1990) were able to assemble the folLarsO.Hedin
lowing long-term mass balance, formatted as in
Equation 17.4:
ldry = 1040 + 20 - 705 - 40
+ 120 eq SO~- ha- I yr- I
It can be seen that the watershed S mass balance is
dominated by hydrologic outputs and wet deposition (in this case, measured as bulk deposition by
Likens et al.). This budget illustrates the strong effect of human-induced atmospheric deposition on
the S budget of a relatively undisturbed forest ecosystem. From this budget, Likens et al. calculated
a long-term average dry deposition of S as approximately 435 eq ha -I yr- t, or as much as approximately 38% of total atmospheric S deposition to
this forest.
Similar to the canopy mass balance, this watershed balance depends on how well the different inputs, outputs, and changes in internal stores of S
are known. Likens et al. argued that these vectors
were either relatively well known (e.g., hydrologic
losses and wet deposition), or of negligible contribution to the overall S balance (e.g., gaseous hydrogen sulfide (H 2 S) losses and changes in internal
storage; + 20 vs. + 120 eq ha -I yr- I ). However,
this may not be the case for other elements, or for
other ecosystems. The advantage of this approach
is that it allows analysis of long-term dynamics, and
that it explicitly compares dry deposition against
other major fluxes of S in the ecosystem.
Stable Isotope and Other
Tracer Techniques
Natural abundances of stable isotopes, and other
watershed-scale tracers, are not commonly used to
understand atmospheric deposition to terrestrial
ecosystems. However, tracer techniques hold considerable promise for studying source-sink relationships across land-atmosphere interfaces in a manner that complements more traditional methods of
study. Tracer techniques have the advantage that
insights can be gained from a relatively limited set
of samples. Some of the utility and robustness of
tracer techniques stems from that, by nature, these
approaches are based on measures of intensive
quantities that do not depend on knowing boundaries of the ecosystem or measurement area (e.g.,
balance: Dry deposition is calculated as the difference between nutrient outputs (fluxes in throughfall
plus stemflow) and nutrient inputs by wet deposition, again corrected for any change in internal storage (e.g., Lovett 1994). This approach assumes that
leaching of nutrients from tree tissues, and chemical reactions between nutrients supplied by wet
deposition and tree tissues, are negligible. This is
not always the case, as some nutrients are affected
by internal canopy sinks and/or sources within canopies. For example, potassium K + is known to be
released from live leafs and canopy K + budgets can
be significantly compromised by this internal
source.
Nevertheless, canopy mass balances are commonly used as alternative measures of dry deposition to forests. Butler and Likens (1995) adopted
these techniques to estimate dry and total deposition of Sand N to forests near Ithaca, NY. They
found that canopy mass-balance techniques gave
deposition values very similar to more standard inferential deposition velocity techniques used by the
National Dry Deposition Network (now CASiNet).
In contrast, Lovett et al. (1992) found important
differences between inferential and mass-balance
measures of S dry deposition to the Hubbard Brook
Experimental Forest, NH.
While it is more difficult to establish mass balances at the scale of entire watersheds, such efforts
can quantify dry deposition to larger areas within
landscapes. For example, Likens et al. (1990) estimated dry S deposition from a 23-year record of
watershed S fluxes at the Hubbard Brook Experimental Forest. Dry deposition was calculated as:
ldry = Ostream + Ogaseous - lwet
- I weathering + Astorage
(17.4)
where ldry = dry deposition input, Ostream is hydrologic output in streams that drain a watertight
watershed, Ogaseous is gaseous outputs as H2S, lwet
is wet deposition input, lweathering is inputs due to
mineral weathering, and Astorage is the net change
in internal S stores in the ecosystem (primarily
sorption/desorption of S in soils, and net plant uptake of S). Based on 23-year records of S bulk
precipitation input, hydrologic losses, and knowledge about changes in internal S pools due to tree
growth and immobilization reactions in soils,
Likens et al. (1990) were able to assemble the folLarsO.Hedin
lowing long-term mass balance, formatted as in
Equation 17.4:
ldry = 1040 + 20 - 705 - 40
+ 120 eq SO~- ha- I yr- I
It can be seen that the watershed S mass balance is
dominated by hydrologic outputs and wet deposition (in this case, measured as bulk deposition by
Likens et al.). This budget illustrates the strong effect of human-induced atmospheric deposition on
the S budget of a relatively undisturbed forest ecosystem. From this budget, Likens et al. calculated
a long-term average dry deposition of S as approximately 435 eq ha -I yr- t, or as much as approximately 38% of total atmospheric S deposition to
this forest.
Similar to the canopy mass balance, this watershed balance depends on how well the different inputs, outputs, and changes in internal stores of S
are known. Likens et al. argued that these vectors
were either relatively well known (e.g., hydrologic
losses and wet deposition), or of negligible contribution to the overall S balance (e.g., gaseous hydrogen sulfide (H 2 S) losses and changes in internal
storage; + 20 vs. + 120 eq ha -I yr- I ). However,
this may not be the case for other elements, or for
other ecosystems. The advantage of this approach
is that it allows analysis of long-term dynamics, and
that it explicitly compares dry deposition against
other major fluxes of S in the ecosystem.
Stable Isotope and Other
Tracer Techniques
Natural abundances of stable isotopes, and other
watershed-scale tracers, are not commonly used to
understand atmospheric deposition to terrestrial
ecosystems. However, tracer techniques hold considerable promise for studying source-sink relationships across land-atmosphere interfaces in a manner that complements more traditional methods of
study. Tracer techniques have the advantage that
insights can be gained from a relatively limited set
of samples. Some of the utility and robustness of
tracer techniques stems from that, by nature, these
approaches are based on measures of intensive
quantities that do not depend on knowing boundaries of the ecosystem or measurement area (e.g.,