

176
1992). Aircraft-based techniques remain expensive
to buy and maintain, and operate for only limited
periods at a time. A more practical alternative is
required that can be used by many research
groups. One method currently being tested is a
mass budget of the CBL, developed by Raupach
et al. (1992). Under commonly encountered daytime conditions, a CBL is present over the surface
of the earth. At the top of this layer is a temperature inversion, which effectively separates the air
that has been influenced by the surface from the
overlying air of the free atmosphere. Over the
course of a day, the CBL grows from tens of meters in the early morning to a height of 1 to 3 km
in the late afternoon, entraining air from the free
atmosphere as it rises. As the photosynthetic rate
increases with irradiance, the CO 2 concentration in
the CBL is reduced below that in the free atmosphere above.
~ 2
U
~
E
~ 0 -t-'o' .... 1iI
Ji
~ :::I -2
c:
.8 ...
~ -4
?
~
~ -6
Q)
::;E
-8
John B. Moncrieff, Paul G. Jarvis, and Ricardo Valentini
In principle, the CBL can be treated as a huge
cuvette, in which the surface fluxes can be inferred
from measured changes in CO2 concentration and
CBL height over time. The method is based on the
conservation of mass equation for CO 2 in the wellmixed CBL, which can be written in integral form
as:
Fe = [(P2h2 + pWt(t2 - tl))(Ct - Crn2)
- P2h(C t - C rnl )]/(t 2 - t l )
(11.33)
where Fe is the flux of CO 2 integrated between time
tl and t2, P is air density averaged over the CBL, h
is the height of the CBL, W t is the vertical velocity
above the CBL, and Crn and C t are the CO2 concentrations in the mixed layer of the CBL and the
free troposphere above, respectively. Equation
11.33 yields cumulative surface fluxes representing
the area traversed by a column of air in the course
of a day, and so may extend a few hundred kilo200
0
.r E
.9
QI
.::.:.
-200
nJ
is.
:3
0::::
0
.s:l
Ii
-400
u
QI
>
' i
"3
E
:3
-600
<.:>
~----------,---~------.-----------,-------~-800
o
100
200
300
Days since 1 January
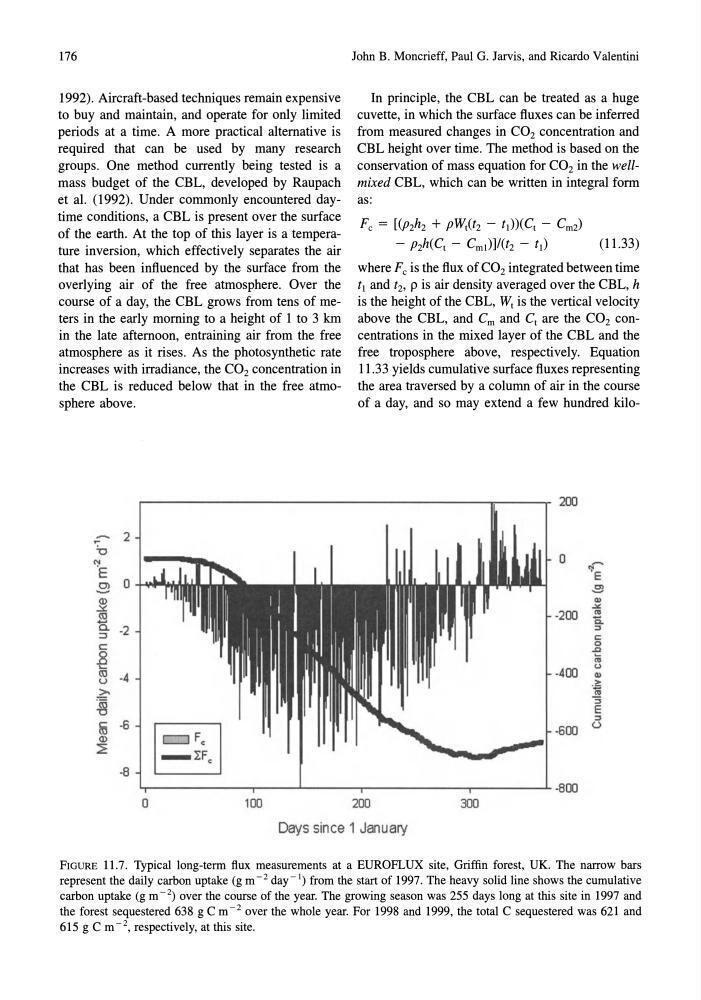
FIGURE 11.7. Typical long-term flux measurements at a EUROFLUX site, Griffin forest, UK. The narrow bars
represent the daily carbon uptake (g m - 2 day - 1) from the start of 1997. The heavy solid line shows the cumulative
carbon uptake (g m - 2) over the course of the year. The growing season was 255 days long at this site in 1997 and
the forest sequestered 638 gem - 2 over the whole year. For 1998 and 1999, the total C sequestered was 621 and
615 g C m- 2 , respectively, at this site.
1992). Aircraft-based techniques remain expensive
to buy and maintain, and operate for only limited
periods at a time. A more practical alternative is
required that can be used by many research
groups. One method currently being tested is a
mass budget of the CBL, developed by Raupach
et al. (1992). Under commonly encountered daytime conditions, a CBL is present over the surface
of the earth. At the top of this layer is a temperature inversion, which effectively separates the air
that has been influenced by the surface from the
overlying air of the free atmosphere. Over the
course of a day, the CBL grows from tens of meters in the early morning to a height of 1 to 3 km
in the late afternoon, entraining air from the free
atmosphere as it rises. As the photosynthetic rate
increases with irradiance, the CO 2 concentration in
the CBL is reduced below that in the free atmosphere above.
~ 2
U
~
E
~ 0 -t-'o' .... 1iI
Ji
~ :::I -2
c:
.8 ...
~ -4
?
~
~ -6
Q)
::;E
-8
John B. Moncrieff, Paul G. Jarvis, and Ricardo Valentini
In principle, the CBL can be treated as a huge
cuvette, in which the surface fluxes can be inferred
from measured changes in CO2 concentration and
CBL height over time. The method is based on the
conservation of mass equation for CO 2 in the wellmixed CBL, which can be written in integral form
as:
Fe = [(P2h2 + pWt(t2 - tl))(Ct - Crn2)
- P2h(C t - C rnl )]/(t 2 - t l )
(11.33)
where Fe is the flux of CO 2 integrated between time
tl and t2, P is air density averaged over the CBL, h
is the height of the CBL, W t is the vertical velocity
above the CBL, and Crn and C t are the CO2 concentrations in the mixed layer of the CBL and the
free troposphere above, respectively. Equation
11.33 yields cumulative surface fluxes representing
the area traversed by a column of air in the course
of a day, and so may extend a few hundred kilo200
0
.r E
.9
QI
.::.:.
-200
nJ
is.
:3
0::::
0
.s:l
Ii
-400
u
QI
>
' i
"3
E
:3
-600
<.:>
~----------,---~------.-----------,-------~-800
o
100
200
300
Days since 1 January
FIGURE 11.7. Typical long-term flux measurements at a EUROFLUX site, Griffin forest, UK. The narrow bars
represent the daily carbon uptake (g m - 2 day - 1) from the start of 1997. The heavy solid line shows the cumulative
carbon uptake (g m - 2) over the course of the year. The growing season was 255 days long at this site in 1997 and
the forest sequestered 638 gem - 2 over the whole year. For 1998 and 1999, the total C sequestered was 621 and
615 g C m- 2 , respectively, at this site.