

11. Canopy Fluxes
N, O·
Portable PC
Gas Chromatograph
( "*tIti...r.CU)III@lI'POC)
PumpBo.with2
Di.phragm Pumps
Desiccanl
~ gg
Tubes
CCC
COD
cOO
COO
Pump Bo. with 2
Diaphragm Pumps
Flow -
M ......
175
- - - Eddy Covariance pipe
DcrMIcIrtught wnpl. pipe
- - - Updra'&htwnpl. pipe
- --Dill Inpw.Cable
••••••••• DigjlllCootroiCabl,
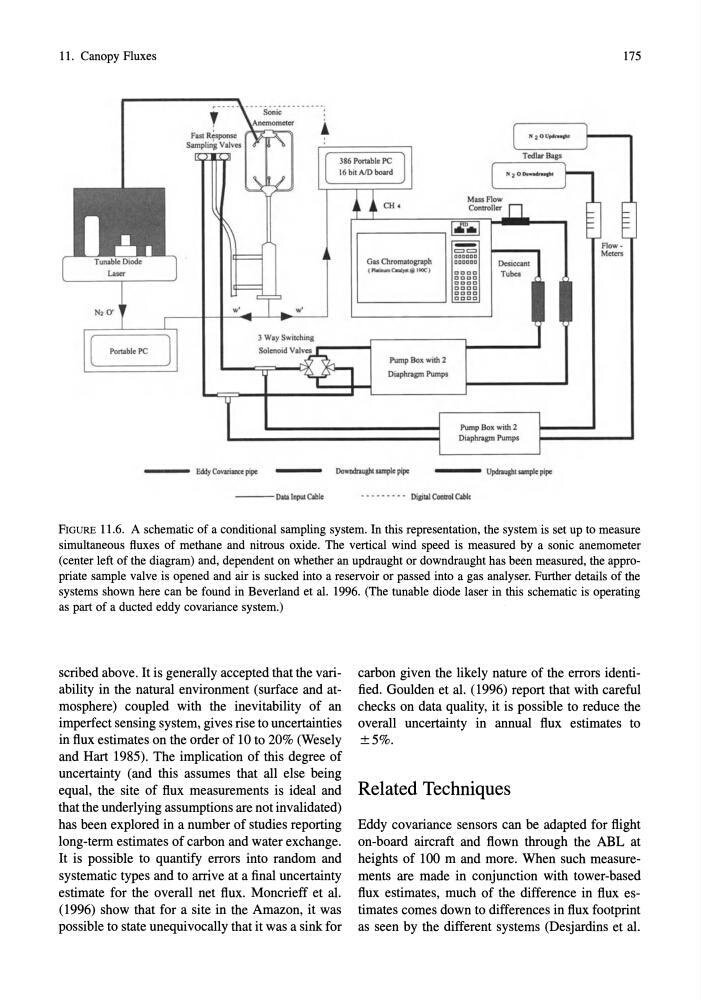
FIGURE 11.6. A schematic of a conditional sampling system. In this representation, the system is set up to measure
simultaneous fluxes of methane and nitrous oxide. The vertical wind speed is measured by a sonic anemometer
(center left of the diagram) and, dependent on whether an updraught or downdraught has been measured, the appropriate sample valve is opened and air is sucked into a reservoir or passed into a gas analyser. Further details of the
systems shown here can be found in Beverland et al. 1996. (The tunable diode laser in this schematic is operating
as part of a ducted eddy covariance system.)
scribed above. It is generally accepted that the variability in the natural environment (surface and atmosphere) coupled with the inevitability of an
imperfect sensing system, gives rise to uncertainties
in flux estimates on the order of 10 to 20% (Wesely
and Hart 1985). The implication of this degree of
uncertainty (and this assumes that all else being
equal, the site of flux measurements is ideal and
that the underlying assumptions are not invalidated)
has been explored in a number of studies reporting
long-term estimates of carbon and water exchange.
It is possible to quantify errors into random and
systematic types and to arrive at a final uncertainty
estimate for the overall net flux. Moncrieff et al.
(1996) show that for a site in the Amazon, it was
possible to state unequivocally that it was a sink for
carbon given the likely nature of the errors identified. Goulden et al. (1996) report that with careful
checks on data quality, it is possible to reduce the
overall uncertainty in annual flux estimates to
±5%.
Related Techniques
Eddy covariance sensors can be adapted for flight
on-board aircraft and flown through the ABL at
heights of 100 m and more. When such measurements are made in conjunction with tower-based
flux estimates, much of the difference in flux estimates comes down to differences in flux footprint
as seen by the different systems (Desjardins et al.
N, O·
Portable PC
Gas Chromatograph
( "*tIti...r.CU)III@lI'POC)
PumpBo.with2
Di.phragm Pumps
Desiccanl
~ gg
Tubes
CCC
COD
cOO
COO
Pump Bo. with 2
Diaphragm Pumps
Flow -
M ......
175
- - - Eddy Covariance pipe
DcrMIcIrtught wnpl. pipe
- - - Updra'&htwnpl. pipe
- --Dill Inpw.Cable
••••••••• DigjlllCootroiCabl,
FIGURE 11.6. A schematic of a conditional sampling system. In this representation, the system is set up to measure
simultaneous fluxes of methane and nitrous oxide. The vertical wind speed is measured by a sonic anemometer
(center left of the diagram) and, dependent on whether an updraught or downdraught has been measured, the appropriate sample valve is opened and air is sucked into a reservoir or passed into a gas analyser. Further details of the
systems shown here can be found in Beverland et al. 1996. (The tunable diode laser in this schematic is operating
as part of a ducted eddy covariance system.)
scribed above. It is generally accepted that the variability in the natural environment (surface and atmosphere) coupled with the inevitability of an
imperfect sensing system, gives rise to uncertainties
in flux estimates on the order of 10 to 20% (Wesely
and Hart 1985). The implication of this degree of
uncertainty (and this assumes that all else being
equal, the site of flux measurements is ideal and
that the underlying assumptions are not invalidated)
has been explored in a number of studies reporting
long-term estimates of carbon and water exchange.
It is possible to quantify errors into random and
systematic types and to arrive at a final uncertainty
estimate for the overall net flux. Moncrieff et al.
(1996) show that for a site in the Amazon, it was
possible to state unequivocally that it was a sink for
carbon given the likely nature of the errors identified. Goulden et al. (1996) report that with careful
checks on data quality, it is possible to reduce the
overall uncertainty in annual flux estimates to
±5%.
Related Techniques
Eddy covariance sensors can be adapted for flight
on-board aircraft and flown through the ABL at
heights of 100 m and more. When such measurements are made in conjunction with tower-based
flux estimates, much of the difference in flux estimates comes down to differences in flux footprint
as seen by the different systems (Desjardins et al.