

162
John B. Moncrieff, Paul G. Jarvis, and Ricardo Valentini
lan
10
Free Atmosphere
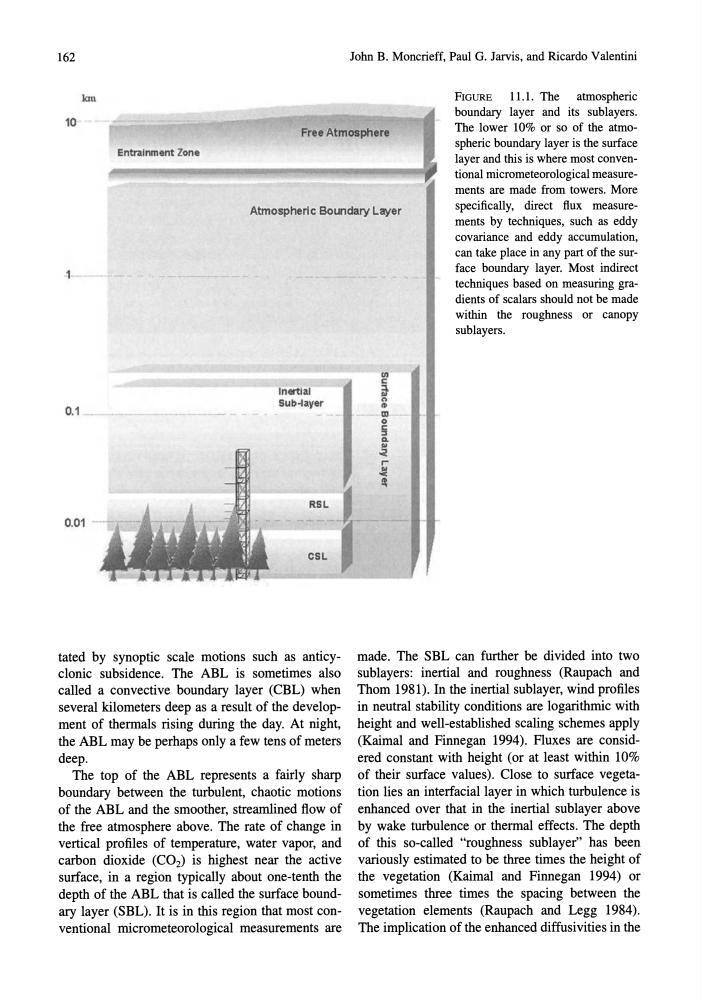
FIGURE
11.1. The
atmospheric
boundary layer and its sublayers.
The lower 10% or so of the atmospheric boundary layer is the surface
layer and this is where most conventional rnicrometeorological measurements are made from towers. More
specifically, direct flux measurements by techniques, such as eddy
covariance and eddy accumulation,
can take place in any part of the surface boundary layer. Most indirect
techniques based on measuring gradients of scalars should not be made
within the roughness or canopy
sublayers.
Entrainment Zone
Atmospheric Boundary Layer
10.1 .
0.Q1
Inertial
Sub-laver
tated by synoptic scale motions such as anticyclonic subsidence. The ABL is sometimes also
called a convective boundary layer (CBL) when
several kilometers deep as a result of the development of thermals rising during the day. At night,
the ABL may be perhaps only a few tens of meters
deep.
The top of the ABL represents a fairly sharp
boundary between the turbulent, chaotic motions
of the ABL and the smoother, streamlined flow of
the free atmosphere above. The rate of change in
vertical profiles of temperature, water vapor, and
carbon dioxide (C02) is highest near the active
surface, in a region typically about one-tenth the
depth of the ABL that is called the surface boundary layer (SBL). It is in this region that most conventional micrometeorological measurements are
III
C
~
.. III
III
o
§
...
~
I""
~
III
. .
made. The SBL can further be divided into two
sublayers: inertial and roughness (Raupach and
Thorn 1981). In the inertial sublayer, wind profiles
in neutral stability conditions are logarithmic with
height and well-established scaling schemes apply
(Kaimal and Finnegan 1994). Fluxes are considered constant with height (or at least within 10%
of their surface values). Close to surface vegetation lies an interfacial layer in which turbulence is
enhanced over that in the inertial sublayer above
by wake turbulence or thermal effects. The depth
of this so-called "roughness sublayer" has been
variously estimated to be three times the height of
the vegetation (Kaimal and Finnegan 1994) or
sometimes three times the spacing between the
vegetation elements (Raupach and Legg 1984).
The implication of the enhanced diffusivities in the
John B. Moncrieff, Paul G. Jarvis, and Ricardo Valentini
lan
10
Free Atmosphere
FIGURE
11.1. The
atmospheric
boundary layer and its sublayers.
The lower 10% or so of the atmospheric boundary layer is the surface
layer and this is where most conventional rnicrometeorological measurements are made from towers. More
specifically, direct flux measurements by techniques, such as eddy
covariance and eddy accumulation,
can take place in any part of the surface boundary layer. Most indirect
techniques based on measuring gradients of scalars should not be made
within the roughness or canopy
sublayers.
Entrainment Zone
Atmospheric Boundary Layer
10.1 .
0.Q1
Inertial
Sub-laver
tated by synoptic scale motions such as anticyclonic subsidence. The ABL is sometimes also
called a convective boundary layer (CBL) when
several kilometers deep as a result of the development of thermals rising during the day. At night,
the ABL may be perhaps only a few tens of meters
deep.
The top of the ABL represents a fairly sharp
boundary between the turbulent, chaotic motions
of the ABL and the smoother, streamlined flow of
the free atmosphere above. The rate of change in
vertical profiles of temperature, water vapor, and
carbon dioxide (C02) is highest near the active
surface, in a region typically about one-tenth the
depth of the ABL that is called the surface boundary layer (SBL). It is in this region that most conventional micrometeorological measurements are
III
C
~
.. III
III
o
§
...
~
I""
~
III
. .
made. The SBL can further be divided into two
sublayers: inertial and roughness (Raupach and
Thorn 1981). In the inertial sublayer, wind profiles
in neutral stability conditions are logarithmic with
height and well-established scaling schemes apply
(Kaimal and Finnegan 1994). Fluxes are considered constant with height (or at least within 10%
of their surface values). Close to surface vegetation lies an interfacial layer in which turbulence is
enhanced over that in the inertial sublayer above
by wake turbulence or thermal effects. The depth
of this so-called "roughness sublayer" has been
variously estimated to be three times the height of
the vegetation (Kaimal and Finnegan 1994) or
sometimes three times the spacing between the
vegetation elements (Raupach and Legg 1984).
The implication of the enhanced diffusivities in the