

8. Stable Isotope Tracers and Mathematical Models in Soil Organic Matter Studies
127
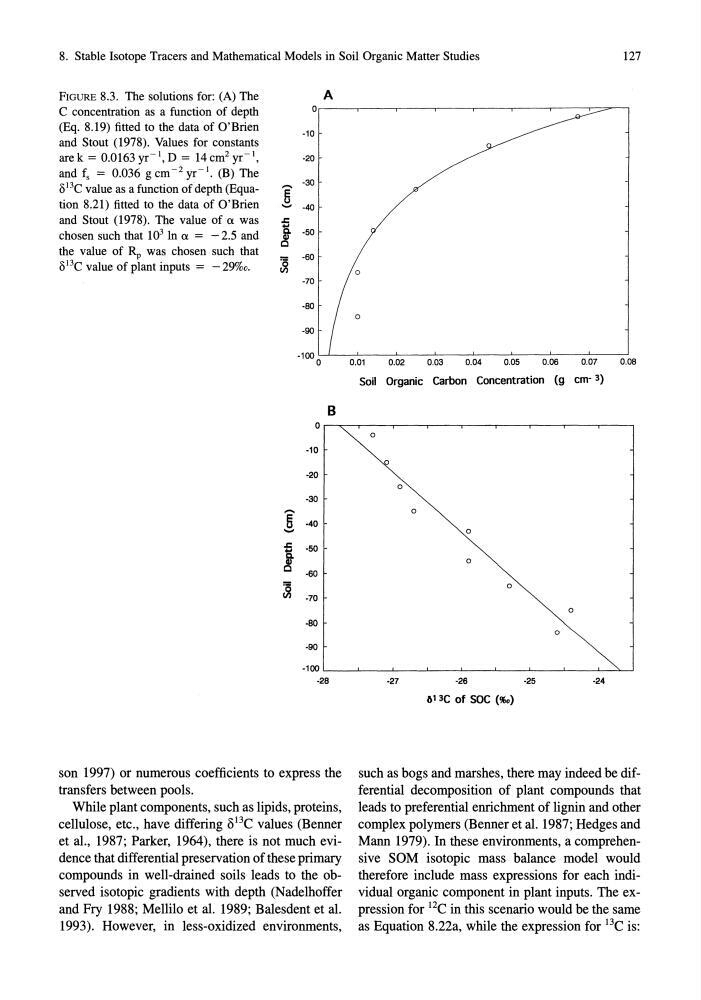
FIGURE 8.3. The solutions for: (A) The
A
C concentration as a function of depth
0
(Eq. 8.19) fitted to the data of O'Brien
-10
and Stout (1978). Values for constants
are k = 0.0163 yr-l, D = 14 cm 2 yr-l,
-20
and fs = 0.036 g cm- 2 yr- t • (B) The
-30
8 13 C value as a function of depth (Equa.....
6
tion 8.21) fitted to the data of O'Brien
...... -40
and Stout (1978). The value of ex was
.c
chosen such that 10 3 In ex = - 2.5 and
~ -50
III
the value of Rp was chosen such that
c
8 13 C value of plant inputs = - 29%0.
~
-60
-70
-80
-90
B
0
-10
-20
·30
.....
6 -40
......
.c -50
~
III
C
-60
~ -70
-80
-90
-100
-28
son 1997) or numerous coefficients to express the
transfers between pools.
While plant components, such as lipids, proteins,
cellulose, etc., have differing o13e values (Benner
et aI., 1987; Parker, 1964), there is not much evidence that differential preservation of these primary
compounds in well-drained soils leads to the observed isotopic gradients with depth (Nadelhoffer
and Fry 1988; Mellilo et al. 1989; Balesdent et aI.
1993). However, in less-oxidized environments,
o
o
0.01
0.02
0.03
0.04
0.05
0.06
0.07
0.08
Soil Organic Carbon Concentration (g cm- 3)
0
0
0
0
0
0
0
0
-27
-26
-25
-24
613C of SOC (%.)
such as bogs and marshes, there may indeed be differential decomposition of plant compounds that
leads to preferential enrichment of lignin and other
complex polymers (Benner et al. 1987; Hedges and
Mann 1979). In these environments, a comprehensive SOM isotopic mass balance model would
therefore include mass expressions for each individual organic component in plant inputs. The expression for 12e in this scenario would be the same
as Equation 8.22a, while the expression for 13e is:
127
FIGURE 8.3. The solutions for: (A) The
A
C concentration as a function of depth
0
(Eq. 8.19) fitted to the data of O'Brien
-10
and Stout (1978). Values for constants
are k = 0.0163 yr-l, D = 14 cm 2 yr-l,
-20
and fs = 0.036 g cm- 2 yr- t • (B) The
-30
8 13 C value as a function of depth (Equa.....
6
tion 8.21) fitted to the data of O'Brien
...... -40
and Stout (1978). The value of ex was
.c
chosen such that 10 3 In ex = - 2.5 and
~ -50
III
the value of Rp was chosen such that
c
8 13 C value of plant inputs = - 29%0.
~
-60
-70
-80
-90
B
0
-10
-20
·30
.....
6 -40
......
.c -50
~
III
C
-60
~ -70
-80
-90
-100
-28
son 1997) or numerous coefficients to express the
transfers between pools.
While plant components, such as lipids, proteins,
cellulose, etc., have differing o13e values (Benner
et aI., 1987; Parker, 1964), there is not much evidence that differential preservation of these primary
compounds in well-drained soils leads to the observed isotopic gradients with depth (Nadelhoffer
and Fry 1988; Mellilo et al. 1989; Balesdent et aI.
1993). However, in less-oxidized environments,
o
o
0.01
0.02
0.03
0.04
0.05
0.06
0.07
0.08
Soil Organic Carbon Concentration (g cm- 3)
0
0
0
0
0
0
0
0
-27
-26
-25
-24
613C of SOC (%.)
such as bogs and marshes, there may indeed be differential decomposition of plant compounds that
leads to preferential enrichment of lignin and other
complex polymers (Benner et al. 1987; Hedges and
Mann 1979). In these environments, a comprehensive SOM isotopic mass balance model would
therefore include mass expressions for each individual organic component in plant inputs. The expression for 12e in this scenario would be the same
as Equation 8.22a, while the expression for 13e is: