

Residues of Organochlorines and TEQs in Fish Collected in the Adriatic Sea
73
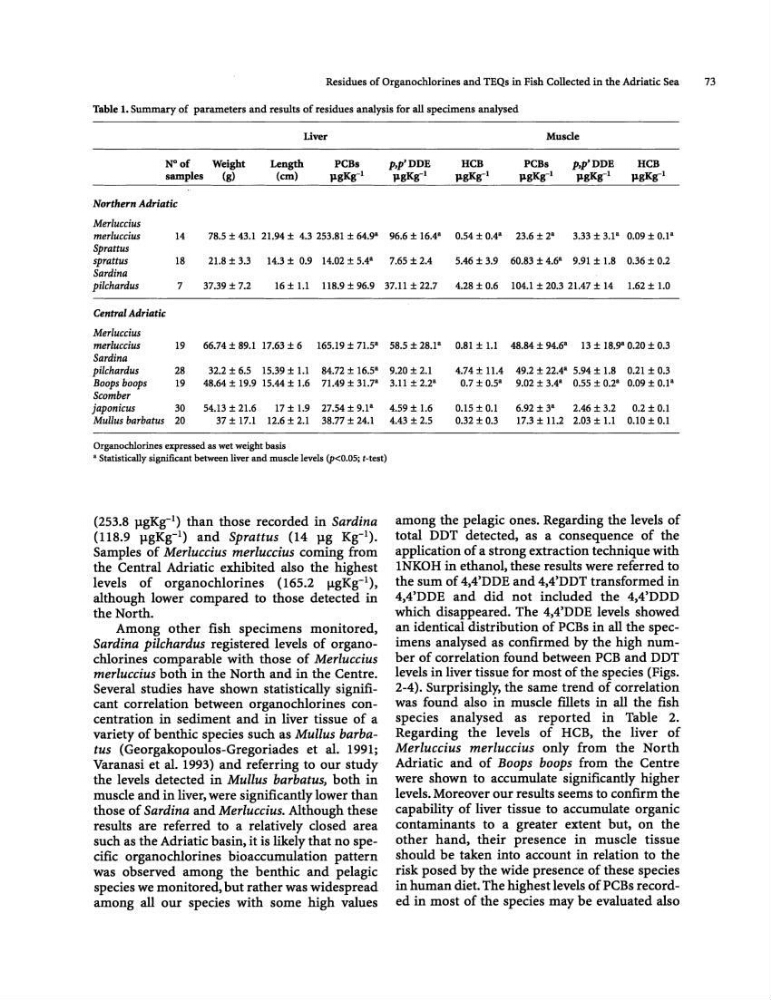
Table 1. Summary of parameters and results of residues analysis for all specimens analysed
Liver
Muscle
N"of
Weight
Length
PCBs
p,p'DDE
HCB
PCBs
p,p'DDE
HeB
samples
(g)
(em)
]lgKg-l
]lgKg-l
]lgKg-1
]lgKg-l
]lgKg-l
]lgKg-l
Northern Adriatic
Merluccius
merluccius
14
78.5 ± 43.1 21.94 ± 4.3 253.81 ± 64.9" 96.6 ± 16.4" 0.54 ± 0.4" 23.6 ± 2"
3.33 ± 3.1" 0.09 ± 0.1"
Sprattus
sprattus
18
21.8 ± 3.3
14.3 ± 0.9 14.02 ± 5.4"7.65 ± 2.4
5.46 ± 3.9 60.83 ± 4.6" 9.91 ± 1.8 0.36 ± 0.2
Sardina
pilchardus
7
37.39 ± 7.2
16 ± 1.1 118.9 ± 96.9 37.11 ± 22.7
4.28 ± 0.6 104.1 ± 20.3 21.47 ± 14 1.62 ± 1.0
Central Adriatic
Merluccius
merluccius
19
66.74 ± 89.1 17.63 ± 6 165.19 ± 71.5"
Sardina
pilchardus
28
32.2 ± 6.5 15.39 ± 1.1 84.72 ± 16.5"
Boopsboops
19
48.64 ± 19.9 15.44 ± 1.6 71.49 ± 31.7 a
Scomber
japonicus
30
54.13 ± 21.6 17 ± 1.9 27.54 ± 9.10.
Mullus barbatus 20
37 ± 17.1 12.6 ± 2.1 38.77 ± 24.1
Organocl:ilorines expressed as wet weight basis
• Statistically significant between liver and muscle levels (p
(118.9 lIgKg-1) and Sprattus (14 lIg Kg-I).
Samples of Merluccius merluccius coming from
the Central Adriatic exhibited also the highest
levels of organochlorines (165.2 IlgKg- 1 ),
although lower compared to those detected in
the North.
Among other fish specimens monitored,
Sardina pilchardus registered levels of organochlorines comparable with those of Merluccius
merluccius both in the North and in the Centre.
Several studies have shown statistically significant correlation between organochlorines concentration in sediment and in liver tissue of a
variety of benthic species such as Mullus barbatus (Georgakopoulos-Gregoriades et aL 1991;
Varanasi et al. 1993) and referring to our study
the levels detected in Mullus barbatus, both in
muscle and in liver, were significantly lower than
those of Sardina and Merluccius. Although these
results are referred to a relatively closed area
such as the Adriatic basin, it is likely that no specific organochlorines bioaccumulation pattern
was observed among the benthic and pelagic
species we monitored. but rather was widespread
among all our species with some high values
58.5 ±28.1 a O.Sl ± 1.1 4S.84 ± 94.6" 13 ± lS.9 a 0.20 ± 0.3
9.20 ± 2.1
4.74 ± 11.4 49.2 ± 22.4& 5.94 ± 1.8 0.21 ± 0.3
3.11 ± 2.2a
0.7 ± 0.5 a 9.02 ± 3.4" 0.55 ± 0.20. 0.09± O.la
4.59 ± 1.6
0.15 ± 0.1 6.92 ± 3" 2.46 ± 3.2 0.2 ± 0.1
4.43 ± 2.5
0.32 ± 0.3 17.3 ± 11.2 2.03 ± 1.1 0.10 ± 0.1
among the pelagic ones. Regarding the levels of
total DDT detected, as a consequence of the
application of a strong extraction technique with
1NKOH in ethanol, these results were referred to
the sum of 4,4'DDE and 4,4'DDT transformed in
4,4'DDE and did not included the 4,4'DDD
which disappeared. The 4,4'DDE levels showed
an identical distribution of PCBs in all the specimens analysed as confirmed by the high number of correlation found between PCB and DDT
levels in liver tissue for most of the species (Figs.
2-4). Surprisingly, the same trend of correlation
was found also in muscle fillets in all the fish
species analysed as reported in Table 2.
Regarding the levels of HCB. the liver of
Merluccius merluccius only from the North
Adriatic and of Boops boops from the Centre
were shown to accumulate significantly higher
levels. Moreover our results seems to confirm the
capability of liver tissue to accumulate organic
contaminants to a greater extent but, on the
other hand, their presence in muscle tissue
should be taken into account in relation to the
risk posed by the wide presence of these species
in human diet. The highest levels of PCBs recorded in most of the species may be evaluated also
73
Table 1. Summary of parameters and results of residues analysis for all specimens analysed
Liver
Muscle
N"of
Weight
Length
PCBs
p,p'DDE
HCB
PCBs
p,p'DDE
HeB
samples
(g)
(em)
]lgKg-l
]lgKg-l
]lgKg-1
]lgKg-l
]lgKg-l
]lgKg-l
Northern Adriatic
Merluccius
merluccius
14
78.5 ± 43.1 21.94 ± 4.3 253.81 ± 64.9" 96.6 ± 16.4" 0.54 ± 0.4" 23.6 ± 2"
3.33 ± 3.1" 0.09 ± 0.1"
Sprattus
sprattus
18
21.8 ± 3.3
14.3 ± 0.9 14.02 ± 5.4"7.65 ± 2.4
5.46 ± 3.9 60.83 ± 4.6" 9.91 ± 1.8 0.36 ± 0.2
Sardina
pilchardus
7
37.39 ± 7.2
16 ± 1.1 118.9 ± 96.9 37.11 ± 22.7
4.28 ± 0.6 104.1 ± 20.3 21.47 ± 14 1.62 ± 1.0
Central Adriatic
Merluccius
merluccius
19
66.74 ± 89.1 17.63 ± 6 165.19 ± 71.5"
Sardina
pilchardus
28
32.2 ± 6.5 15.39 ± 1.1 84.72 ± 16.5"
Boopsboops
19
48.64 ± 19.9 15.44 ± 1.6 71.49 ± 31.7 a
Scomber
japonicus
30
54.13 ± 21.6 17 ± 1.9 27.54 ± 9.10.
Mullus barbatus 20
37 ± 17.1 12.6 ± 2.1 38.77 ± 24.1
Organocl:ilorines expressed as wet weight basis
• Statistically significant between liver and muscle levels (p
(118.9 lIgKg-1) and Sprattus (14 lIg Kg-I).
Samples of Merluccius merluccius coming from
the Central Adriatic exhibited also the highest
levels of organochlorines (165.2 IlgKg- 1 ),
although lower compared to those detected in
the North.
Among other fish specimens monitored,
Sardina pilchardus registered levels of organochlorines comparable with those of Merluccius
merluccius both in the North and in the Centre.
Several studies have shown statistically significant correlation between organochlorines concentration in sediment and in liver tissue of a
variety of benthic species such as Mullus barbatus (Georgakopoulos-Gregoriades et aL 1991;
Varanasi et al. 1993) and referring to our study
the levels detected in Mullus barbatus, both in
muscle and in liver, were significantly lower than
those of Sardina and Merluccius. Although these
results are referred to a relatively closed area
such as the Adriatic basin, it is likely that no specific organochlorines bioaccumulation pattern
was observed among the benthic and pelagic
species we monitored. but rather was widespread
among all our species with some high values
58.5 ±28.1 a O.Sl ± 1.1 4S.84 ± 94.6" 13 ± lS.9 a 0.20 ± 0.3
9.20 ± 2.1
4.74 ± 11.4 49.2 ± 22.4& 5.94 ± 1.8 0.21 ± 0.3
3.11 ± 2.2a
0.7 ± 0.5 a 9.02 ± 3.4" 0.55 ± 0.20. 0.09± O.la
4.59 ± 1.6
0.15 ± 0.1 6.92 ± 3" 2.46 ± 3.2 0.2 ± 0.1
4.43 ± 2.5
0.32 ± 0.3 17.3 ± 11.2 2.03 ± 1.1 0.10 ± 0.1
among the pelagic ones. Regarding the levels of
total DDT detected, as a consequence of the
application of a strong extraction technique with
1NKOH in ethanol, these results were referred to
the sum of 4,4'DDE and 4,4'DDT transformed in
4,4'DDE and did not included the 4,4'DDD
which disappeared. The 4,4'DDE levels showed
an identical distribution of PCBs in all the specimens analysed as confirmed by the high number of correlation found between PCB and DDT
levels in liver tissue for most of the species (Figs.
2-4). Surprisingly, the same trend of correlation
was found also in muscle fillets in all the fish
species analysed as reported in Table 2.
Regarding the levels of HCB. the liver of
Merluccius merluccius only from the North
Adriatic and of Boops boops from the Centre
were shown to accumulate significantly higher
levels. Moreover our results seems to confirm the
capability of liver tissue to accumulate organic
contaminants to a greater extent but, on the
other hand, their presence in muscle tissue
should be taken into account in relation to the
risk posed by the wide presence of these species
in human diet. The highest levels of PCBs recorded in most of the species may be evaluated also