

72
I. Corsi et al.
latory control for dioxin-like compounds such as
PCBs (Safe 1990,1993; Ahlborg et al. 1994). It was
recognised that as the recommended toxic equivalency factors (TEFs) have been developed for
exposure scenarios then the corresponding values may be appropriate for body burden consideration and ecotoxicity purposes (Ahlborg et al.
1994).
Materials and Methods
Sampling was carried out in 2 stages: the first in
the Northern Adriatic off the coast of Venetum
and the second in the Central Adriatic close to
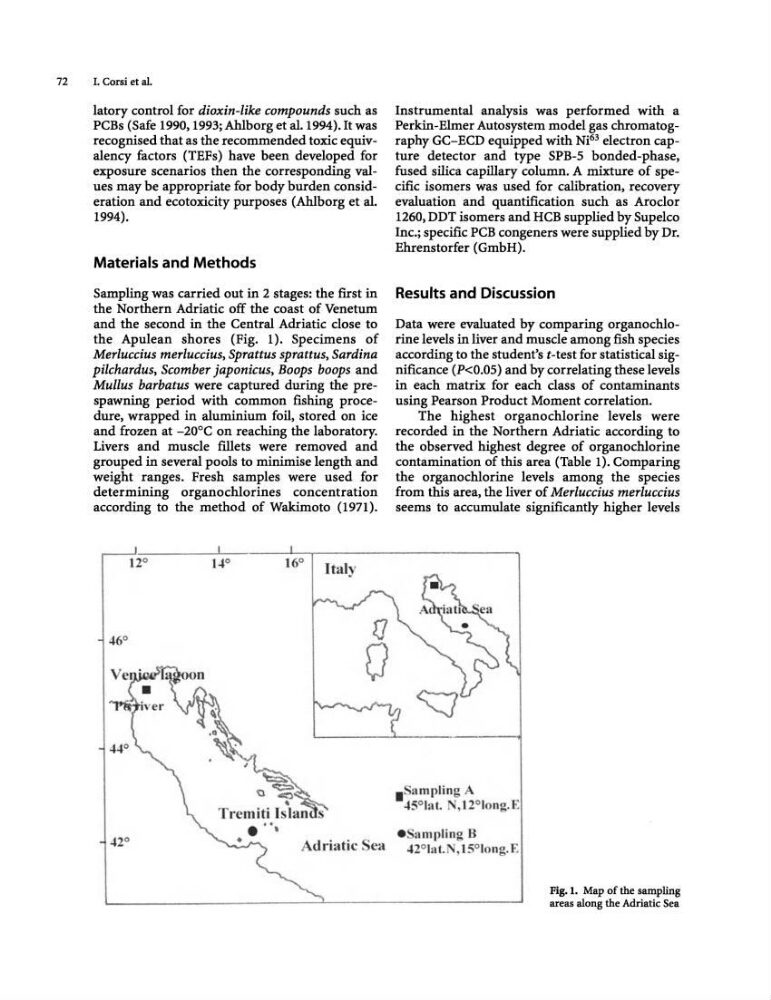
the Apulean shores (Fig. 1). Specimens of
Merluccius merluccius, Sprattus sprattus, Sardina
pilchardus, Scomber japonicus, Hoops boops and
Mullus barbatus were captured during the prespawning period with common fishing procedure, wrapped in aluminium foil, stored on ice
and frozen at -20°C on reaching the laboratory.
Livers and muscle flliets were removed and
grouped in several pools to minimise length and
weight ranges. Fresh samples were used for
determining organochlorines concentration
according to the method of Wakimoto (1971).
12°
Ituly
Instrumental analysis was performed with a
Perkin-Elmer Autosystem model gas chromatography GC-ECD equipped with Ni 63 electron capture detector and type SPB-S bonded-phase,
fused silica capillary column. A mixture of specific isomers was used for calibration, recovery
evaluation and quantification such as Aroclor
1260, DDT isomers and HCB supplied by Supelco
Inc.; specific PCB congeners were supplied by Dr.
Ehrenstorfer (GmbH).
Results and Discussion
Data were evaluated by comparing organochlorine levels in liver and muscle among fish species
according to the student's t-test for statistical significance (P
using Pearson Product Moment correlation.
The highest organochlorine levels were
recorded in the Northern Adriatic according to
the observed highest degree of organochlorine
contamination of this area (Table I). Comparing
the organochlorine levels among the species
from this area, the liver of Merluccius merluccius
seems to accumulate significantly higher levels
.Sampling A
-'5°lat. , t2°long. E
• 'a mplino B
driatic ea ,,12 0 lat. lS 0 lo ng. E
Fig.!. Map of the sampling
areas along the Adriatic Sea
I. Corsi et al.
latory control for dioxin-like compounds such as
PCBs (Safe 1990,1993; Ahlborg et al. 1994). It was
recognised that as the recommended toxic equivalency factors (TEFs) have been developed for
exposure scenarios then the corresponding values may be appropriate for body burden consideration and ecotoxicity purposes (Ahlborg et al.
1994).
Materials and Methods
Sampling was carried out in 2 stages: the first in
the Northern Adriatic off the coast of Venetum
and the second in the Central Adriatic close to
the Apulean shores (Fig. 1). Specimens of
Merluccius merluccius, Sprattus sprattus, Sardina
pilchardus, Scomber japonicus, Hoops boops and
Mullus barbatus were captured during the prespawning period with common fishing procedure, wrapped in aluminium foil, stored on ice
and frozen at -20°C on reaching the laboratory.
Livers and muscle flliets were removed and
grouped in several pools to minimise length and
weight ranges. Fresh samples were used for
determining organochlorines concentration
according to the method of Wakimoto (1971).
12°
Ituly
Instrumental analysis was performed with a
Perkin-Elmer Autosystem model gas chromatography GC-ECD equipped with Ni 63 electron capture detector and type SPB-S bonded-phase,
fused silica capillary column. A mixture of specific isomers was used for calibration, recovery
evaluation and quantification such as Aroclor
1260, DDT isomers and HCB supplied by Supelco
Inc.; specific PCB congeners were supplied by Dr.
Ehrenstorfer (GmbH).
Results and Discussion
Data were evaluated by comparing organochlorine levels in liver and muscle among fish species
according to the student's t-test for statistical significance (P
using Pearson Product Moment correlation.
The highest organochlorine levels were
recorded in the Northern Adriatic according to
the observed highest degree of organochlorine
contamination of this area (Table I). Comparing
the organochlorine levels among the species
from this area, the liver of Merluccius merluccius
seems to accumulate significantly higher levels
.Sampling A
-'5°lat. , t2°long. E
• 'a mplino B
driatic ea ,,12 0 lat. lS 0 lo ng. E
Fig.!. Map of the sampling
areas along the Adriatic Sea