

62
L. Boni et al.
160
140
120
100
E
0, 80
::I- 60
40
20
o
Polysaccharides/m I culture
tot polys
extr polys
a
oGon
iii Gymn
o Pror
Thai
Ach
C.clos
C.fus
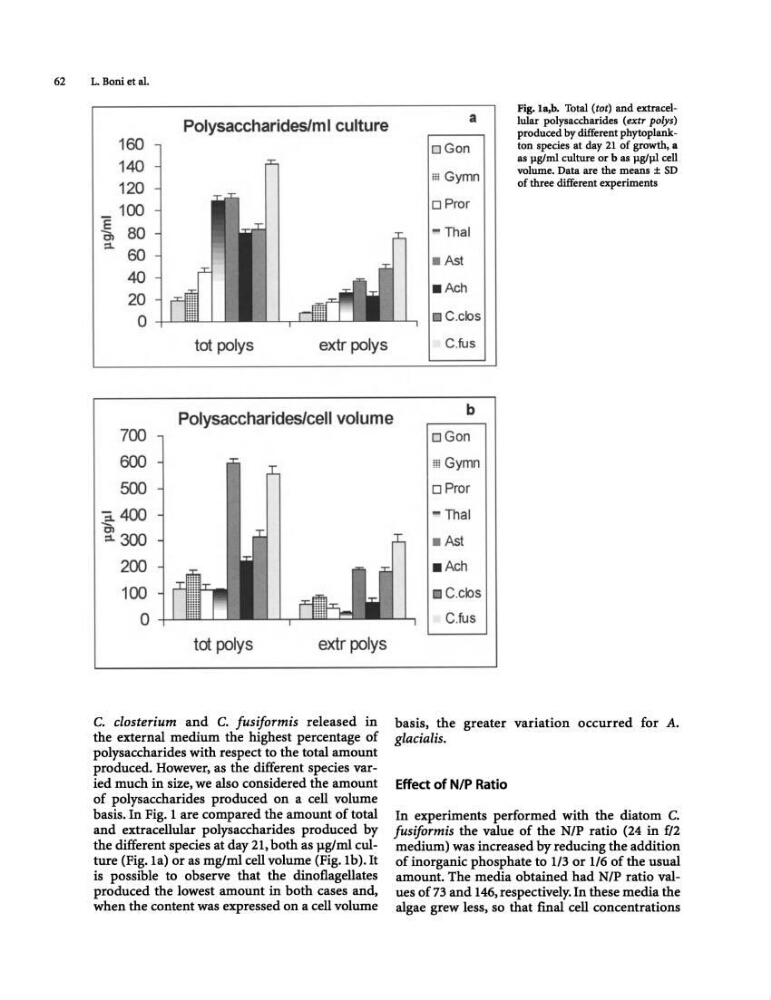
Fig. la,b. Total (tot) and extracellular polysaccharides (extr polys)
produced by different phytoplankton species at day 21 of growth, a
as llg/ml culture or b as llg/pl cell
volume. Data are the means ± SD
of three different experiments
Polysaccharides/cell volume
b
700
600
500
~4oo
tn
:::1.300
200
100
o
tot polys
extr polys
C. closterium and C. fusiformis released in
the external medium the highest percentage of
polysaccharides with respect to the total amount
produced. However, as the different species varied much in size, we also considered the amount
of polysaccharides produced on a cell volume
basis. In Fig. 1 are compared the amount of total
and extracellular polysaccharides produced by
the different species at day 21, both as }lglml cul~
ture (Fig.1a) or as mglml cell volume (Fig.1b). It
is possible to observe that the dinoflagellates
produced the lowest amount in both cases and,
when the content was expressed on a cell volume
oGon
m Gymn
o Pror
- Thai
• Ast
.Ach
C.clos
C.fus
basis, the greater variation occurred for A.
glacialis.
Effect of NIP Ratio
In experiments performed with the diatom C.
fusiformis the value of the NIP ratio (24 in f/2
medium) was increased by reducing the addition
of inorganic phosphate to 1/3 or 116 of the usual
amount. The media obtained had NIP ratio values of 73 and 146, respectively. In these media the
algae grew less, so that final cell concentrations
L. Boni et al.
160
140
120
100
E
0, 80
::I- 60
40
20
o
Polysaccharides/m I culture
tot polys
extr polys
a
oGon
iii Gymn
o Pror
Thai
Ach
C.clos
C.fus
Fig. la,b. Total (tot) and extracellular polysaccharides (extr polys)
produced by different phytoplankton species at day 21 of growth, a
as llg/ml culture or b as llg/pl cell
volume. Data are the means ± SD
of three different experiments
Polysaccharides/cell volume
b
700
600
500
~4oo
tn
:::1.300
200
100
o
tot polys
extr polys
C. closterium and C. fusiformis released in
the external medium the highest percentage of
polysaccharides with respect to the total amount
produced. However, as the different species varied much in size, we also considered the amount
of polysaccharides produced on a cell volume
basis. In Fig. 1 are compared the amount of total
and extracellular polysaccharides produced by
the different species at day 21, both as }lglml cul~
ture (Fig.1a) or as mglml cell volume (Fig.1b). It
is possible to observe that the dinoflagellates
produced the lowest amount in both cases and,
when the content was expressed on a cell volume
oGon
m Gymn
o Pror
- Thai
• Ast
.Ach
C.clos
C.fus
basis, the greater variation occurred for A.
glacialis.
Effect of NIP Ratio
In experiments performed with the diatom C.
fusiformis the value of the NIP ratio (24 in f/2
medium) was increased by reducing the addition
of inorganic phosphate to 1/3 or 116 of the usual
amount. The media obtained had NIP ratio values of 73 and 146, respectively. In these media the
algae grew less, so that final cell concentrations