

52
B. Manca et al.
a
C
Spring '95: Gorgano Transect
W
Density (kg.m-J)
E
HOI H02 HO.3 H04 1-105 H06 H07 HOS H09 HIO HII
5
50
o:~~ii~_o
25
100
150
200
I
' 250
a 10 20 30 40 50 60 70 80
Distance (km)
Autumn ' 95: Gargano T ronsecl
o
10
20
30
40
50
60
70
80
90
Distance (km)
Summer ' 95: Gorgano Transect
b
W
Density (kg.m- l )
E
HOI H02 H03 h04 H05 H06 H07 H08 Hog HI O HI H12
O'+-~--~~--~~--~~--~~--~~ O
5
<:- 10
i
Q. 15
20
25 a 10 20 30 40 50 60 70 80 90
Distance (km)
Winter ' 96: Gorgono T ronsecl
o
10
20
30
40
50
60
70
60
90
Distance (km)
50
100
150
200
250
d
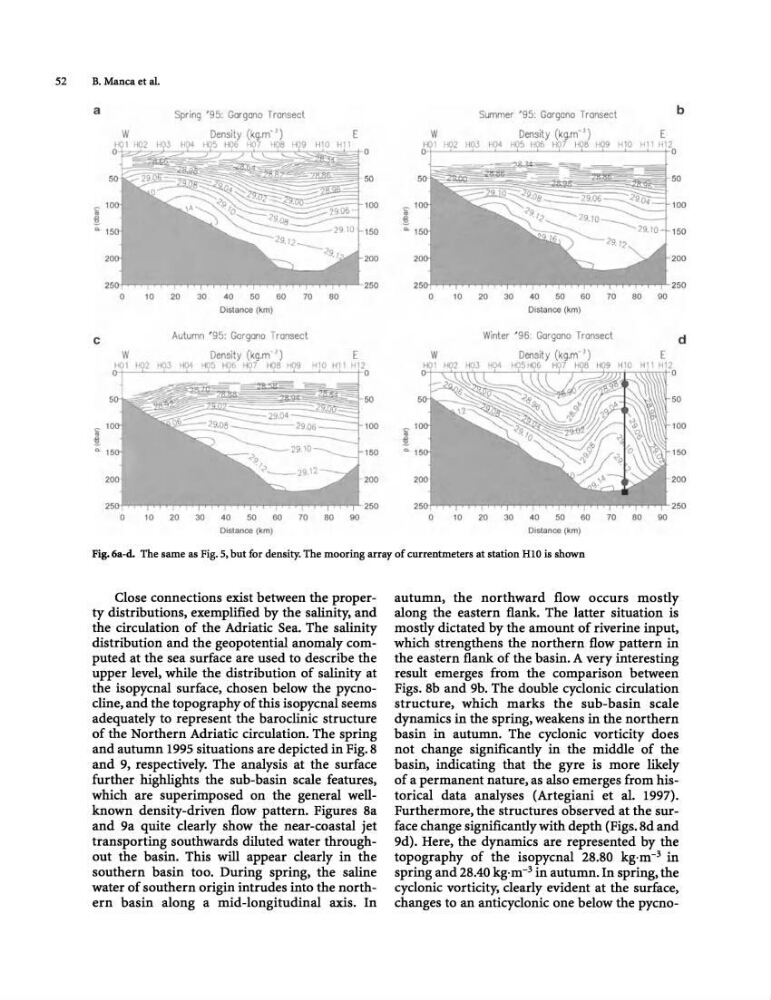
Fig. 6a-d. The same as Fig. 5, but for density. The mooring array of currentmeters at station HlO is shown
Close connections exist between the property distributions, exemplified by the salinity, and
the circulation of the Adriatic Sea. The salinity
distribution and the geopotential anomaly computed at the sea surface are used to describe the
upper level, while the distribution of salinity at
the isopycnal surface, chosen below the pycnocline, and the topography of this isopycnal seems
adequately to represent the baroclinic structure
of the Northern Adriatic circulation. The spring
and autumn 1995 situations are depicted in Fig. 8
and 9, respectively. The analysis at the surface
further highlights the sub-basin scale features,
which are superimposed on the general wellknown density-driven flow pattern. Figures 8a
and 9a quite clearly show the near-coastal jet
transporting southwards diluted water throughout the basin. This will appear clearly in the
southern basin too. During spring, the saline
water of southern origin intrudes into the northern basin along a mid-longitudinal axis. In
autumn, the northward flow occurs mostly
along the eastern flank. The latter situation is
mostly dictated by the amount of riverine input,
which strengthens the northern flow pattern in
the eastern flank of the basin. A very interesting
result emerges from the comparison between
Figs. 8b and 9b. The double cyclonic circulation
structure, which marks the sub-basin scale
dynamics in the spring, weakens in the northern
basin in autumn. The cyclonic vorticity does
not change significantly in the middle of the
basin, indicating that the gyre is more likely
of a permanent nature, as also emerges from historical data analyses (Artegiani et al. 1997).
Furthermore, the structures observed at the surface change significantly with depth (Figs. 8d and
9d). Here, the dynamics are represented by the
topography of the isopycnal 28.80 kg·m- 3 in
spring and 28.40 kg·m- 3 in autumn. In spring, the
cyclonic vorticity, clearly evident at the surface,
changes to an anticyclonic one below the pycno-
B. Manca et al.
a
C
Spring '95: Gorgano Transect
W
Density (kg.m-J)
E
HOI H02 HO.3 H04 1-105 H06 H07 HOS H09 HIO HII
5
50
o:~~ii~_o
25
100
150
200
I
' 250
a 10 20 30 40 50 60 70 80
Distance (km)
Autumn ' 95: Gargano T ronsecl
o
10
20
30
40
50
60
70
80
90
Distance (km)
Summer ' 95: Gorgano Transect
b
W
Density (kg.m- l )
E
HOI H02 H03 h04 H05 H06 H07 H08 Hog HI O HI H12
O'+-~--~~--~~--~~--~~--~~ O
5
<:- 10
i
Q. 15
20
25 a 10 20 30 40 50 60 70 80 90
Distance (km)
Winter ' 96: Gorgono T ronsecl
o
10
20
30
40
50
60
70
60
90
Distance (km)
50
100
150
200
250
d
Fig. 6a-d. The same as Fig. 5, but for density. The mooring array of currentmeters at station HlO is shown
Close connections exist between the property distributions, exemplified by the salinity, and
the circulation of the Adriatic Sea. The salinity
distribution and the geopotential anomaly computed at the sea surface are used to describe the
upper level, while the distribution of salinity at
the isopycnal surface, chosen below the pycnocline, and the topography of this isopycnal seems
adequately to represent the baroclinic structure
of the Northern Adriatic circulation. The spring
and autumn 1995 situations are depicted in Fig. 8
and 9, respectively. The analysis at the surface
further highlights the sub-basin scale features,
which are superimposed on the general wellknown density-driven flow pattern. Figures 8a
and 9a quite clearly show the near-coastal jet
transporting southwards diluted water throughout the basin. This will appear clearly in the
southern basin too. During spring, the saline
water of southern origin intrudes into the northern basin along a mid-longitudinal axis. In
autumn, the northward flow occurs mostly
along the eastern flank. The latter situation is
mostly dictated by the amount of riverine input,
which strengthens the northern flow pattern in
the eastern flank of the basin. A very interesting
result emerges from the comparison between
Figs. 8b and 9b. The double cyclonic circulation
structure, which marks the sub-basin scale
dynamics in the spring, weakens in the northern
basin in autumn. The cyclonic vorticity does
not change significantly in the middle of the
basin, indicating that the gyre is more likely
of a permanent nature, as also emerges from historical data analyses (Artegiani et al. 1997).
Furthermore, the structures observed at the surface change significantly with depth (Figs. 8d and
9d). Here, the dynamics are represented by the
topography of the isopycnal 28.80 kg·m- 3 in
spring and 28.40 kg·m- 3 in autumn. In spring, the
cyclonic vorticity, clearly evident at the surface,
changes to an anticyclonic one below the pycno-