

482
P. Del Negro et at
(DOM) to marine systems (via extracellular exudation, sloppy feeding by grazers, and particle
decomposition), and bacteria represent the primary consumers of DOM (Alldredge et a1. 1993;
Furhman 1999).
To evaluate the predator-prey dependence,
the correlation between bacterial and HN abundance was calculated. It has been demonstrated,
in fact, that bacterial biomass is positively correlated with HN biomass across a wide range of
marine and freshwater environments (Berninger
et a1. 1991; Sanders et al. 1992). The bacteria/HN
abundance ratio was used as an index of grazing
pressure (Krstulovic et al. 1998). The results
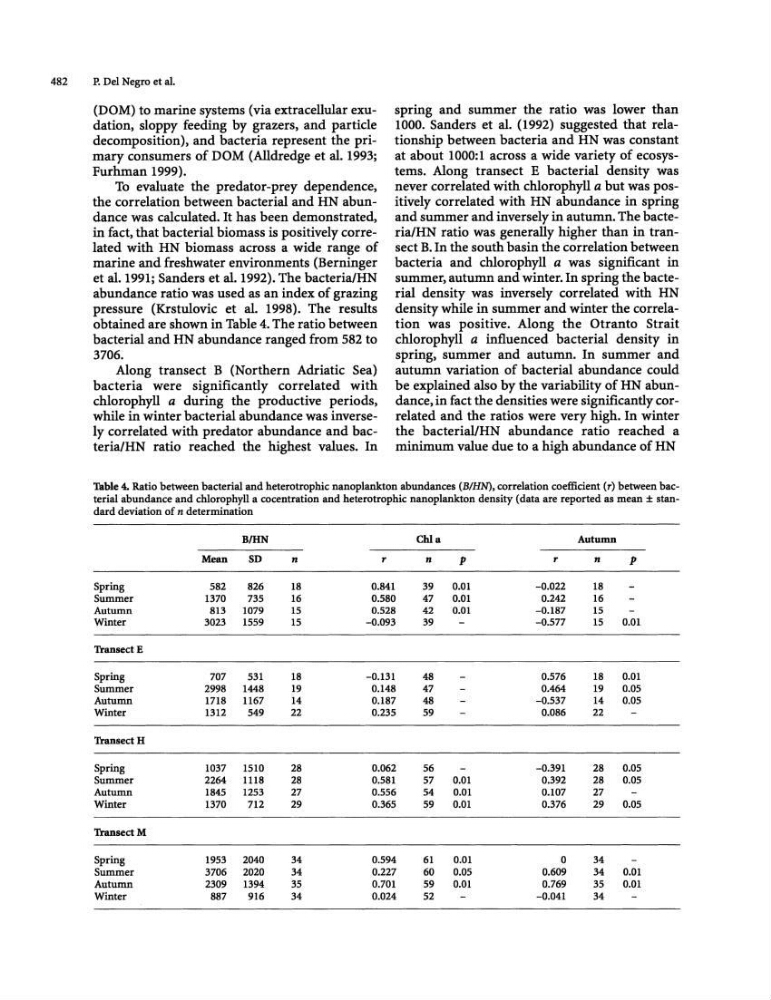
obtained are shown in Table 4. The ratio between
bacterial and HN abundance ranged from 582 to
3706.
Along transect B (Northern Adriatic Sea)
bacteria were significantly correlated with
chlorophyll a during the productive periods,
while in winter bacterial abundance was inversely correlated with predator abundance and bacteria/HN ratio reached the highest values. In
spring and summer the ratio was lower than
1000. Sanders et al. (1992) suggested that relationship between bacteria and HN was constant
at about 1000:1 across a wide variety of ecosystems. Along transect E bacterial density was
never correlated with chlorophyll a but was positively correlated with HN abundance in spring
and summer and inversely in autumn. The bacteria/HN ratio was generally higher than in transect B. In the south basin the correlation between
bacteria and chlorophyll a was significant in
summer, autumn and winter. In spring the bacterial density was inversely correlated with HN
density while in summer and winter the correlation was positive. Along the Otranto Strait
chlorophyll a influenced bacterial density in
spring, summer and autumn. In summer and
autumn variation of bacterial abundance could
be explained also by the variability of HN abundance, in fact the densities were significantly correlated and the ratios were very high. In winter
the bacteriallHN abundance ratio reached a
minimum value due to a high abundance of HN
Table 4. Ratio between bacterial and heterotrophic nanoplankton abundances (B/HN), correlation coefficient (r) between bacterial abundance and chlorophyll a cocentration and heterotrophic nanoplankton density (data are reported as mean ± standard deviation of n determination
B/HN
ChI a
Autumn
Mean
SD
n
r
n
p
r
n
p
Spring
582
826
18
0.841
39
0.01
-0.022
18
Summer
1370
735
16
0.580
47
0.01
0.242
16
Autumn
813
1079
15
0.528
42
0.01
-0.187
15
Winter
3023
1559
15
-0.093
39
-0.577
15
0.01
TransectE
Spring
707
531
18
-0.131
48
0.576
18
0.01
Summer
2998
1448
19
0.148
47
0.464
19
0.05
Autumn
1718
1167
14
0.187
48
-0.537
14
0.05
Winter
1312
549
22
0.235
59
0.086
22
TransectH
Spring
1037
1510
28
0.062
56
-0.391
28
0.05
Summer
2264
lU8
28
0.581
57
om
0.392
28
0.05
Autumn
1845
1253
27
0.556
54
0.01
0.107
27
Winter
1370
712
29
0.365
59
0.01
0.376
29
0.05
TransectM
Spring
1953
2040
34
0.594
61
0.01
0
34
Summer
3706
2020
34
0.227
60
0.05
0.609
34
0.01
Autumn
2309
1394
35
0.701
59
0.01
0.769
35
0.01
Winter
887
916
34
0.024
52
-0.041
34
P. Del Negro et at
(DOM) to marine systems (via extracellular exudation, sloppy feeding by grazers, and particle
decomposition), and bacteria represent the primary consumers of DOM (Alldredge et a1. 1993;
Furhman 1999).
To evaluate the predator-prey dependence,
the correlation between bacterial and HN abundance was calculated. It has been demonstrated,
in fact, that bacterial biomass is positively correlated with HN biomass across a wide range of
marine and freshwater environments (Berninger
et a1. 1991; Sanders et al. 1992). The bacteria/HN
abundance ratio was used as an index of grazing
pressure (Krstulovic et al. 1998). The results
obtained are shown in Table 4. The ratio between
bacterial and HN abundance ranged from 582 to
3706.
Along transect B (Northern Adriatic Sea)
bacteria were significantly correlated with
chlorophyll a during the productive periods,
while in winter bacterial abundance was inversely correlated with predator abundance and bacteria/HN ratio reached the highest values. In
spring and summer the ratio was lower than
1000. Sanders et al. (1992) suggested that relationship between bacteria and HN was constant
at about 1000:1 across a wide variety of ecosystems. Along transect E bacterial density was
never correlated with chlorophyll a but was positively correlated with HN abundance in spring
and summer and inversely in autumn. The bacteria/HN ratio was generally higher than in transect B. In the south basin the correlation between
bacteria and chlorophyll a was significant in
summer, autumn and winter. In spring the bacterial density was inversely correlated with HN
density while in summer and winter the correlation was positive. Along the Otranto Strait
chlorophyll a influenced bacterial density in
spring, summer and autumn. In summer and
autumn variation of bacterial abundance could
be explained also by the variability of HN abundance, in fact the densities were significantly correlated and the ratios were very high. In winter
the bacteriallHN abundance ratio reached a
minimum value due to a high abundance of HN
Table 4. Ratio between bacterial and heterotrophic nanoplankton abundances (B/HN), correlation coefficient (r) between bacterial abundance and chlorophyll a cocentration and heterotrophic nanoplankton density (data are reported as mean ± standard deviation of n determination
B/HN
ChI a
Autumn
Mean
SD
n
r
n
p
r
n
p
Spring
582
826
18
0.841
39
0.01
-0.022
18
Summer
1370
735
16
0.580
47
0.01
0.242
16
Autumn
813
1079
15
0.528
42
0.01
-0.187
15
Winter
3023
1559
15
-0.093
39
-0.577
15
0.01
TransectE
Spring
707
531
18
-0.131
48
0.576
18
0.01
Summer
2998
1448
19
0.148
47
0.464
19
0.05
Autumn
1718
1167
14
0.187
48
-0.537
14
0.05
Winter
1312
549
22
0.235
59
0.086
22
TransectH
Spring
1037
1510
28
0.062
56
-0.391
28
0.05
Summer
2264
lU8
28
0.581
57
om
0.392
28
0.05
Autumn
1845
1253
27
0.556
54
0.01
0.107
27
Winter
1370
712
29
0.365
59
0.01
0.376
29
0.05
TransectM
Spring
1953
2040
34
0.594
61
0.01
0
34
Summer
3706
2020
34
0.227
60
0.05
0.609
34
0.01
Autumn
2309
1394
35
0.701
59
0.01
0.769
35
0.01
Winter
887
916
34
0.024
52
-0.041
34