

eukaryotic and prokaryotic organisms have been
found and phycoerytrin-rich cyanobacteria represented the main group (Table 2).
Heterotrophic nanoplankton abundances
ranged from 1 x 10 2 to 1.9 X 10 3 cell mL -1 and
were mostly due to small flagellates (3-5 pm size)
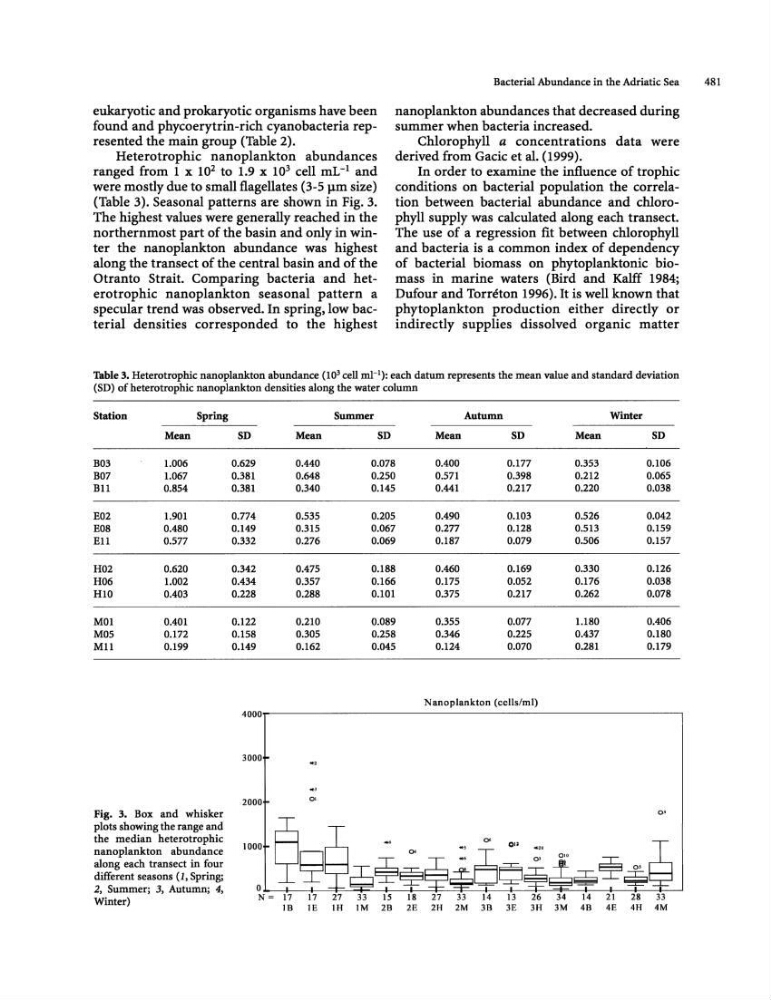
(Table 3). Seasonal patterns are shown in Fig. 3.
The highest values were generally reached in the
northernmost part of the basin and only in winter the nanoplankton abundance was highest
along the transect of the central basin and of the
Otranto Strait. Comparing bacteria and heterotrophic nanoplankton seasonal pattern a
specular trend was observed. In spring, low bacterial densities corresponded to the highest
Bacterial Abundance in the Adriatic Sea
481
nanoplankton abundances that decreased during
summer when bacteria increased.
Chlorophyll a concentrations data were
derived from Gadc et al. (1999).
In order to examine the influence of trophic
conditions on bacterial population the correlation between bacterial abundance and chlorophyll supply was calculated along each transect.
The use of a regression fit between chlorophyll
and bacteria is a common index of dependency
of bacterial biomass on phytoplanktonic biomass in marine waters (Bird and Kalff 1984;
Dufour and Torreton 1996). It is well known that
phytoplankton production either directly or
indirectly supplies dissolved organic matter
Table 3. Heterotrophic nanoplankton abundance (10 3 cell ml- 1 ): each datum represents the mean value and standard deviation
(SD) of heterotrophic nanoplankton densities along the water column
Station
Spring
Mean
B03
1.006
B07
1.067
Bll
0.854
E02
1.901
E08
0.480
Ell
0.577
H02
0.620
H06
1.002
HID
0.403
MOl
0.401
M05
0.172
MIl
0.199
Fig. 3. Box and whisker
plots showing the range and
the median heterotrophic
nanoplankton abundance
along each transect in four
different seasons (1, Spring;
2, Summer; 3, Autumn; 4,
Winter)
Summer
Autumn
Winter
SD
Mean
SD
Mean
SD
Mean
SD
0.629
0.440
0.078
0.400
0.177
0.353
0.106
0.381
0.648
0.250
0.571
0.398
0.212
0.065
0.381
0.340
0.145
0.441
0.217
0.220
0.038
0.774
0.535
0.205
0.490
0.103
0.526
0.042
0.149
0.315
0.067
0.277
0.128
0.513
0.159
0.332
0.276
0.069
0.187
0.079
0.506
0.157
0.342
0.475
0.188
0.460
0.169
0.330
0.126
0.434
0.357
0.166
0.175
0.052
0.176
0.038
0.228
0.288
0.101
0.375
0.217
0.262
0.078
0.122
0.210
0.089
0.355
0.077
1.180
0.406
0.158
0.305
0.258
0.346
0.225
0.437
O.ISO
0.149
0.162
0.045
0.124
0.070
0.281
0.179
N anopiankton (celJs/ml)
4000~-------------------------------------------------------.
3000
2000
o·
~,---'----,~~~~
~~=~1~7~~17~=E~~~~-*~~~~~~~--~~~-714~~2~1~2~8--~33c-~
1000
IB
IE
4B
4E
4H 4M
found and phycoerytrin-rich cyanobacteria represented the main group (Table 2).
Heterotrophic nanoplankton abundances
ranged from 1 x 10 2 to 1.9 X 10 3 cell mL -1 and
were mostly due to small flagellates (3-5 pm size)
(Table 3). Seasonal patterns are shown in Fig. 3.
The highest values were generally reached in the
northernmost part of the basin and only in winter the nanoplankton abundance was highest
along the transect of the central basin and of the
Otranto Strait. Comparing bacteria and heterotrophic nanoplankton seasonal pattern a
specular trend was observed. In spring, low bacterial densities corresponded to the highest
Bacterial Abundance in the Adriatic Sea
481
nanoplankton abundances that decreased during
summer when bacteria increased.
Chlorophyll a concentrations data were
derived from Gadc et al. (1999).
In order to examine the influence of trophic
conditions on bacterial population the correlation between bacterial abundance and chlorophyll supply was calculated along each transect.
The use of a regression fit between chlorophyll
and bacteria is a common index of dependency
of bacterial biomass on phytoplanktonic biomass in marine waters (Bird and Kalff 1984;
Dufour and Torreton 1996). It is well known that
phytoplankton production either directly or
indirectly supplies dissolved organic matter
Table 3. Heterotrophic nanoplankton abundance (10 3 cell ml- 1 ): each datum represents the mean value and standard deviation
(SD) of heterotrophic nanoplankton densities along the water column
Station
Spring
Mean
B03
1.006
B07
1.067
Bll
0.854
E02
1.901
E08
0.480
Ell
0.577
H02
0.620
H06
1.002
HID
0.403
MOl
0.401
M05
0.172
MIl
0.199
Fig. 3. Box and whisker
plots showing the range and
the median heterotrophic
nanoplankton abundance
along each transect in four
different seasons (1, Spring;
2, Summer; 3, Autumn; 4,
Winter)
Summer
Autumn
Winter
SD
Mean
SD
Mean
SD
Mean
SD
0.629
0.440
0.078
0.400
0.177
0.353
0.106
0.381
0.648
0.250
0.571
0.398
0.212
0.065
0.381
0.340
0.145
0.441
0.217
0.220
0.038
0.774
0.535
0.205
0.490
0.103
0.526
0.042
0.149
0.315
0.067
0.277
0.128
0.513
0.159
0.332
0.276
0.069
0.187
0.079
0.506
0.157
0.342
0.475
0.188
0.460
0.169
0.330
0.126
0.434
0.357
0.166
0.175
0.052
0.176
0.038
0.228
0.288
0.101
0.375
0.217
0.262
0.078
0.122
0.210
0.089
0.355
0.077
1.180
0.406
0.158
0.305
0.258
0.346
0.225
0.437
O.ISO
0.149
0.162
0.045
0.124
0.070
0.281
0.179
N anopiankton (celJs/ml)
4000~-------------------------------------------------------.
3000
2000
o·
~,---'----,~~~~
~~=~1~7~~17~=E~~~~-*~~~~~~~--~~~-714~~2~1~2~8--~33c-~
1000
IB
IE
4B
4E
4H 4M