

460
A. Puddu et aL
300
- 200
:E
:1.
- 0
?H
0
100
29 Q
0
?9? ¢O
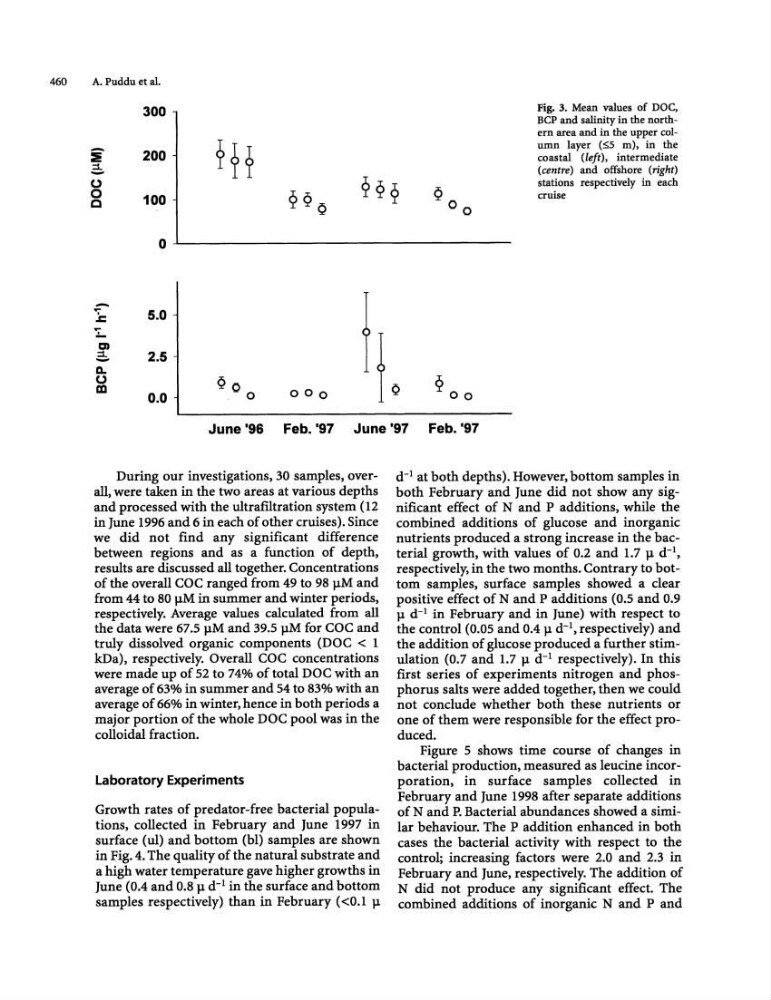
Fig. 3. Mean values of DOC,
BCP and salinity in the northern area and in the upper column layer (:;;5 m), in the
coastal (left), intermediate
(centre) and offshore (right)
stations respectively in each
cruise
0
0
-
1:
5.0
....
~
L
m
:1.
2.5
- a...
0
90
200
m
0.0
0
000
June '96 Feb. '97 June '97 Feb. '97
During our investigations. 30 samples. overall, were taken in the two areas at various depths
and processed with the ultrafiltration system (12
in June 1996 and 6 in each of other cruises). Since
we did not find any significant difference
between regions and as a function of depth,
results are discussed all together. Concentrations
of the overall coe ranged from 49 to 98 JlM and
from 44 to 80 JlM in summer and winter periods,
respectively. Average values calculated from all
the data were 67.5 JlM and 39.5 JlM for coe and
truly dissolved organic components (DOC < 1
kDa), respectively. Overall COC concentrations
were made up of 52 to 74% of total DOC with an
average of 63% in summer and 54 to 83% with an
average of 66% in winter, hence in both periods a
major portion of the whole DOC pool was in the
colloidal fraction.
Laboratory Experiments
Growth rates of predator-free ba.cterial populations, collected in February and June 1997 in
surface (ul) and bottom (bI) samples are shown
in Fig. 4. The quality of the natural substrate and
a high water temperature gave higher growths in
June (0.4 and 0.8 p. d- l in the surface and bottom
samples respectively) than in February «0.1 Jl
d- 1 at both depths), However, bottom samples in
both February and June did not show any significant effect of N and P additions, while the
combined additions of glucose and inorganic
nutrients produced a strong increase in the bacterial growth, with values of 0.2 and 1.7 Jl d- 1 ,
respectively, in the two months. Contrary to bottom samples. surface samples showed a dear
positive effect of N and P additions (0.5 and 0.9
Jl d- 1 in February and in June) with respect to
the control (0.05 and 0.4 Jl d- 1 , respectively) and
the addition of glucose produced a further stimulation (0.7 and 1.7 Jl d- 1 respectively). In this
first series of experiments nitrogen and phosphorus salts were added together, then we could
not conclude whether both these nutrients or
one of them were responsible for the effect produced.
Figure 5 shows time course of changes in
bacterial production, measured as leucine incorporation, in surface samples collected in
February and June 1998 after separate additions
of N and P. Bacterial abundances showed a similar behaviour. The P addition enhanced in both
cases the bacterial activity with respect to the
control; increasing factors were 2.0 and 2.3 in
February and June, respectively. The addition of
N did not produce any significant effect. The
combined additions of inorganic Nand P and
A. Puddu et aL
300
- 200
:E
:1.
- 0
?H
0
100
29 Q
0
?9? ¢O
Fig. 3. Mean values of DOC,
BCP and salinity in the northern area and in the upper column layer (:;;5 m), in the
coastal (left), intermediate
(centre) and offshore (right)
stations respectively in each
cruise
0
0
-
1:
5.0
....
~
L
m
:1.
2.5
- a...
0
90
200
m
0.0
0
000
June '96 Feb. '97 June '97 Feb. '97
During our investigations. 30 samples. overall, were taken in the two areas at various depths
and processed with the ultrafiltration system (12
in June 1996 and 6 in each of other cruises). Since
we did not find any significant difference
between regions and as a function of depth,
results are discussed all together. Concentrations
of the overall coe ranged from 49 to 98 JlM and
from 44 to 80 JlM in summer and winter periods,
respectively. Average values calculated from all
the data were 67.5 JlM and 39.5 JlM for coe and
truly dissolved organic components (DOC < 1
kDa), respectively. Overall COC concentrations
were made up of 52 to 74% of total DOC with an
average of 63% in summer and 54 to 83% with an
average of 66% in winter, hence in both periods a
major portion of the whole DOC pool was in the
colloidal fraction.
Laboratory Experiments
Growth rates of predator-free ba.cterial populations, collected in February and June 1997 in
surface (ul) and bottom (bI) samples are shown
in Fig. 4. The quality of the natural substrate and
a high water temperature gave higher growths in
June (0.4 and 0.8 p. d- l in the surface and bottom
samples respectively) than in February «0.1 Jl
d- 1 at both depths), However, bottom samples in
both February and June did not show any significant effect of N and P additions, while the
combined additions of glucose and inorganic
nutrients produced a strong increase in the bacterial growth, with values of 0.2 and 1.7 Jl d- 1 ,
respectively, in the two months. Contrary to bottom samples. surface samples showed a dear
positive effect of N and P additions (0.5 and 0.9
Jl d- 1 in February and in June) with respect to
the control (0.05 and 0.4 Jl d- 1 , respectively) and
the addition of glucose produced a further stimulation (0.7 and 1.7 Jl d- 1 respectively). In this
first series of experiments nitrogen and phosphorus salts were added together, then we could
not conclude whether both these nutrients or
one of them were responsible for the effect produced.
Figure 5 shows time course of changes in
bacterial production, measured as leucine incorporation, in surface samples collected in
February and June 1998 after separate additions
of N and P. Bacterial abundances showed a similar behaviour. The P addition enhanced in both
cases the bacterial activity with respect to the
control; increasing factors were 2.0 and 2.3 in
February and June, respectively. The addition of
N did not produce any significant effect. The
combined additions of inorganic Nand P and