

June '96
o
2
r---6---,--._-...., 0
A
.
•
A
10
20
•
¢
February '91
10
20
A
30
40
DOC Seasonality in N.Adriatic and Aggregate Formation
459
June '97
5
10
February '98
o
2
r----"""rA,---...., 0
__ J' I
u•
A
•
A
10
0~
20
] :
15
e.
c: A '------'----=-'-_-' 30
L--_ _ --'--_ _ - ' 50
L--_ _ --'--_ _ - ' 20
' - - - - - - ' - - - - - ' 30
o 100 200 300
0
100
200
0
100
200
0
100
200
o
2
o
1
2 0 2 4 6 8
r-~;;:----,-,;;;,---------, 0
r:-1)---," ----, D
0
•
t,
•
10
2D
30
•
[,.
~
10
10
10
20
20
2D
30
40
!
~
J
'-----'--------''---------' 40
' - - - - - - - ' - - - - - ' 50
' - - - - - - - - - ' - - - ' 40
' - - - - - ' - - - - - ' 40
o 100 200 300
0
100
200
0
100
200
0
100
200
-+- DOC(~)
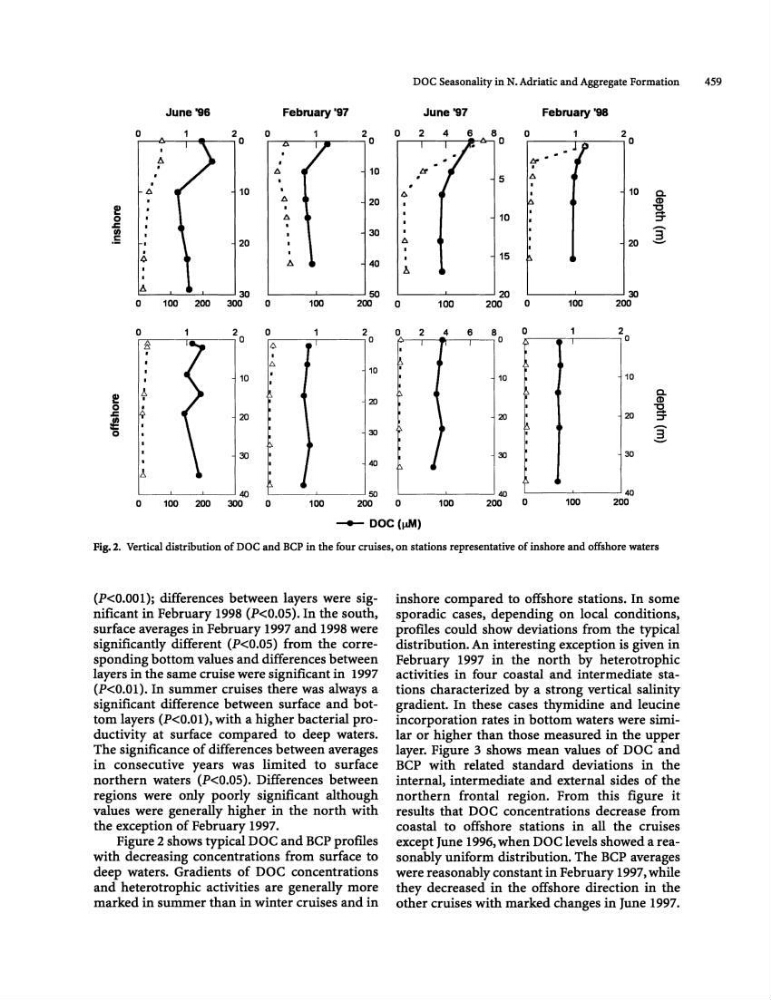
Fig. 2. Vertical distribution of DOC and BCP in the four cruises, on stations representative of inshore and offshore waters
(P
significantly different (P
(P
in consecutive years was limited to surface
northern waters (P
values were generally higher in the north with
the exception of February 1997.
Figure 2 shows typical DOC and BCP profiles
with decreasing concentrations from surface to
deep waters. Gradients of DOC concentrations
and heterotrophic activities are generally more
marked in summer than in winter cruises and in
inshore compared to offshore stations. In some
sporadic cases, depending on local conditions,
proftles could show deviations from the typical
distribution. An interesting exception is given in
February 1997 in the north by heterotrophic
activities in four coastal and intermediate stations characterized by a strong vertical salinity
gradient. In these cases thymidine and leucine
incorporation rates in bottom waters were similar or higher than those measured in the upper
layer. Figure 3 shows mean values of DOC and
BCP with related standard deviations in the
internal, intermediate and external sides of the
northern frontal region. From this figure it
results that DOC concentrations decrease from
coastal to offshore stations in all the cruises
except June 1996, when DOC levels showed a reasonably uniform distribution. The BCP averages
were reasonably constant in February 1997, while
they decreased in the offshore direction in the
other cruises with marked changes in June 1997.
o
2
r---6---,--._-...., 0
A
.
•
A
10
20
•
¢
February '91
10
20
A
30
40
DOC Seasonality in N.Adriatic and Aggregate Formation
459
June '97
5
10
February '98
o
2
r----"""rA,---...., 0
__ J' I
u•
A
•
A
10
0~
20
] :
15
e.
c: A '------'----=-'-_-' 30
L--_ _ --'--_ _ - ' 50
L--_ _ --'--_ _ - ' 20
' - - - - - - ' - - - - - ' 30
o 100 200 300
0
100
200
0
100
200
0
100
200
o
2
o
1
2 0 2 4 6 8
r-~;;:----,-,;;;,---------, 0
r:-1)---," ----, D
0
•
t,
•
10
2D
30
•
[,.
~
10
10
10
20
20
2D
30
40
!
~
J
'-----'--------''---------' 40
' - - - - - - - ' - - - - - ' 50
' - - - - - - - - - ' - - - ' 40
' - - - - - ' - - - - - ' 40
o 100 200 300
0
100
200
0
100
200
0
100
200
-+- DOC(~)
Fig. 2. Vertical distribution of DOC and BCP in the four cruises, on stations representative of inshore and offshore waters
(P
significantly different (P
(P
in consecutive years was limited to surface
northern waters (P
values were generally higher in the north with
the exception of February 1997.
Figure 2 shows typical DOC and BCP profiles
with decreasing concentrations from surface to
deep waters. Gradients of DOC concentrations
and heterotrophic activities are generally more
marked in summer than in winter cruises and in
inshore compared to offshore stations. In some
sporadic cases, depending on local conditions,
proftles could show deviations from the typical
distribution. An interesting exception is given in
February 1997 in the north by heterotrophic
activities in four coastal and intermediate stations characterized by a strong vertical salinity
gradient. In these cases thymidine and leucine
incorporation rates in bottom waters were similar or higher than those measured in the upper
layer. Figure 3 shows mean values of DOC and
BCP with related standard deviations in the
internal, intermediate and external sides of the
northern frontal region. From this figure it
results that DOC concentrations decrease from
coastal to offshore stations in all the cruises
except June 1996, when DOC levels showed a reasonably uniform distribution. The BCP averages
were reasonably constant in February 1997, while
they decreased in the offshore direction in the
other cruises with marked changes in June 1997.