

Hg and As in Continental and Marine Sediments from Southern Tuscany
431
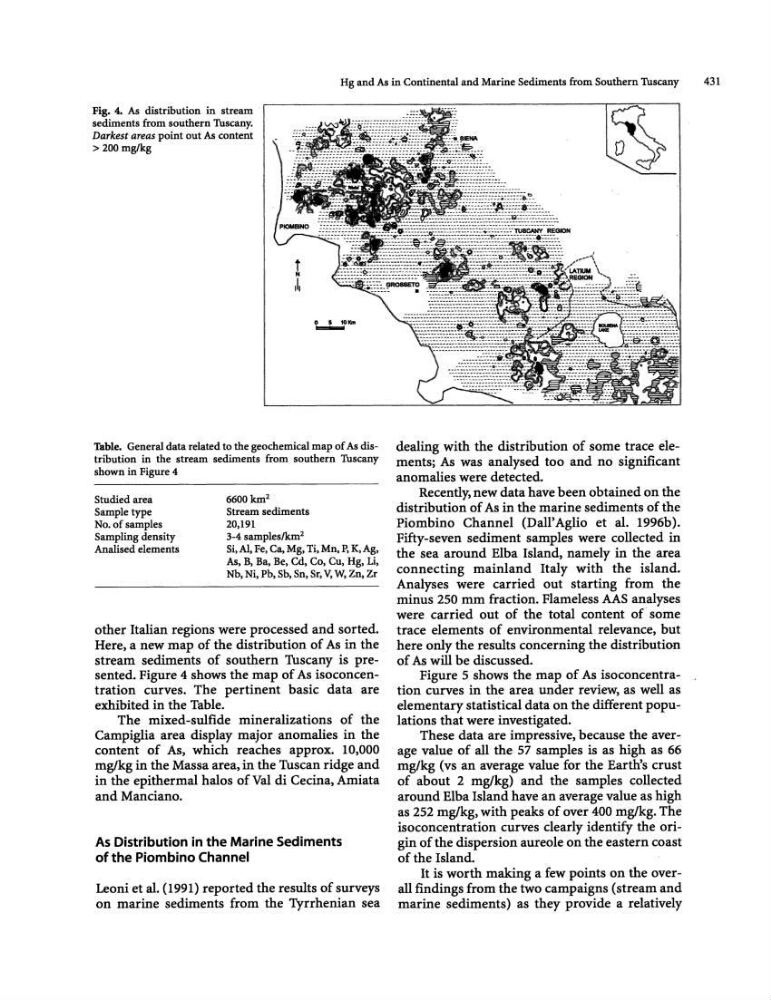
Fig. 4. As distribution in stream
sediments from southern Tuscany.
Darkest areas point out As content
> 200 mg/kg
\I
5
flll(m
-
Table. General data related to the geochemical map of As distribution in the stream sediments from southern Tuscany
shown in Figure 4
Studied area
Sample type
No. of samples
Sampling density
Analised elements
6600km 2
Stream sediments
20,191
3-4 samplesJkml
Si, AI, Fe, Ca. Mg, Ti. Mn, p, K, Ag,
As, B, Ba. Be, Cd, Co, Cu, Hg, Li,
Nh, Ni, Ph, Sb, Sn, Sr, V; W, Zn, Zr
other Italian regions were processed and sorted.
Here, a new map of the distribution of As in the
stream sediments of southern Tuscany is presented. Figure 4 shows the map of As isoconcentration curves. The pertinent basic data are
exhibited in the Table.
The mixed-sulfide mineralizations of the
Campiglia area display major anomalies in the
content of As, which reaches approx. 10,000
mglkg in the Massa area, in the Tuscan ridge and
in the epithermal halos of Val di Cecina, Amiata
and Manciano.
As Distribution in the Marine Sediments
of the Piombino Channel
Leoni et al. (1991) reported the results of surveys
on marine sediments from the Tyrrhenian sea
dealing with the distribution of some trace elements; As was analysed too and no significant
anomalies were detected.
Recently. new data have been obtained on the
distribution of As in the marine sediments of the
Piombino Channel (Dall' Aglio et al. 1996b).
Fifty-seven sediment samples were collected in
the sea around Elba Island, namely in the area
connecting mainland Italy with the island.
Analyses were carried out starting from the
minus 250 mm fraction. Flameless AAS analyses
were carried out of the total content of some
trace elements of environmental relevance, but
here only the results concerning the distribution
of As will be discussed.
Figure 5 shows the map of As isoconcentration curves in the area under review, as well as
elementary statistical data on the different populations that were investigated.
These data are impressive, because the average value of all the 57 samples is as high as 66
mg/kg (vs an average value for the Earth's crust
of about 2 mglkg) and the samples collected
around Elba Island have an average value as high
as 252 mglkg, with peaks of over 400 mglkg. The
isoconcentration curves clearly identify the origin of the dispersion aureole on the eastern coast
of the Island.
It is worth making a few points on the overall findings from the two campaigns (stream and
marine sediments) as they provide a relatively
431
Fig. 4. As distribution in stream
sediments from southern Tuscany.
Darkest areas point out As content
> 200 mg/kg
\I
5
flll(m
-
Table. General data related to the geochemical map of As distribution in the stream sediments from southern Tuscany
shown in Figure 4
Studied area
Sample type
No. of samples
Sampling density
Analised elements
6600km 2
Stream sediments
20,191
3-4 samplesJkml
Si, AI, Fe, Ca. Mg, Ti. Mn, p, K, Ag,
As, B, Ba. Be, Cd, Co, Cu, Hg, Li,
Nh, Ni, Ph, Sb, Sn, Sr, V; W, Zn, Zr
other Italian regions were processed and sorted.
Here, a new map of the distribution of As in the
stream sediments of southern Tuscany is presented. Figure 4 shows the map of As isoconcentration curves. The pertinent basic data are
exhibited in the Table.
The mixed-sulfide mineralizations of the
Campiglia area display major anomalies in the
content of As, which reaches approx. 10,000
mglkg in the Massa area, in the Tuscan ridge and
in the epithermal halos of Val di Cecina, Amiata
and Manciano.
As Distribution in the Marine Sediments
of the Piombino Channel
Leoni et al. (1991) reported the results of surveys
on marine sediments from the Tyrrhenian sea
dealing with the distribution of some trace elements; As was analysed too and no significant
anomalies were detected.
Recently. new data have been obtained on the
distribution of As in the marine sediments of the
Piombino Channel (Dall' Aglio et al. 1996b).
Fifty-seven sediment samples were collected in
the sea around Elba Island, namely in the area
connecting mainland Italy with the island.
Analyses were carried out starting from the
minus 250 mm fraction. Flameless AAS analyses
were carried out of the total content of some
trace elements of environmental relevance, but
here only the results concerning the distribution
of As will be discussed.
Figure 5 shows the map of As isoconcentration curves in the area under review, as well as
elementary statistical data on the different populations that were investigated.
These data are impressive, because the average value of all the 57 samples is as high as 66
mg/kg (vs an average value for the Earth's crust
of about 2 mglkg) and the samples collected
around Elba Island have an average value as high
as 252 mglkg, with peaks of over 400 mglkg. The
isoconcentration curves clearly identify the origin of the dispersion aureole on the eastern coast
of the Island.
It is worth making a few points on the overall findings from the two campaigns (stream and
marine sediments) as they provide a relatively