

Sexual Reproduction and Genetic Diversity in P. oceanica
387
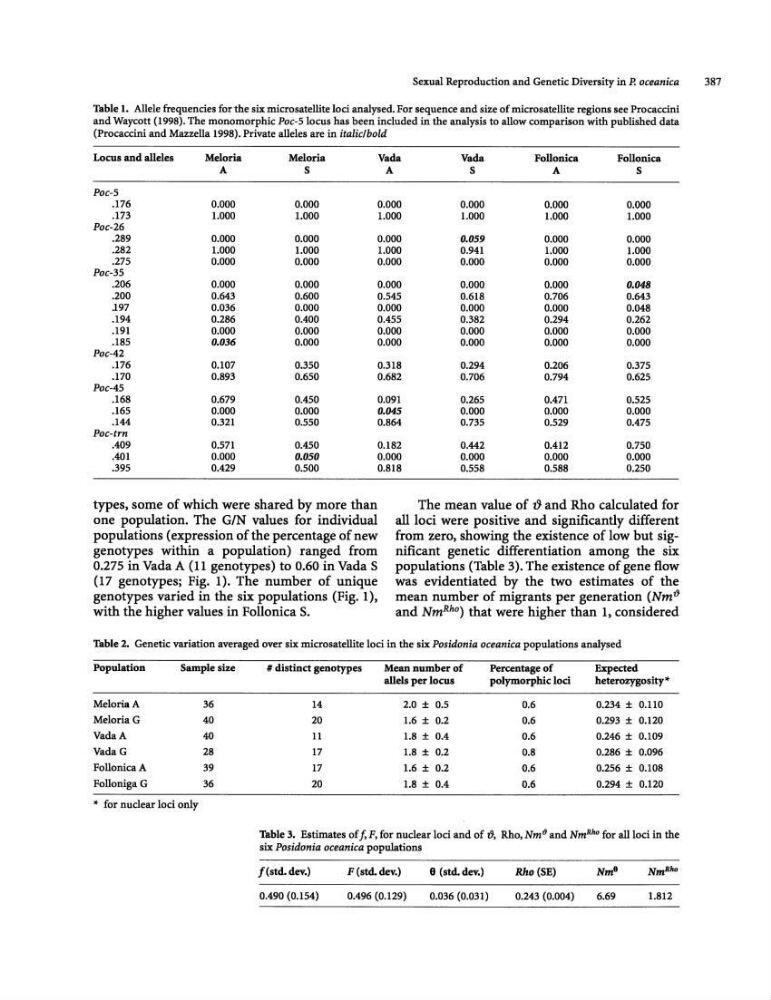
Table 1. Allele frequencies for the six microsatellite loci analysed. For sequence and size of microsateIHte regions see Procaccini
and Waycott (1998). The monomorphic Poc-5 locus has been included in the analysis to allow comparison with published data
(Procaccini and Mazzella 1998). Private alleles are in italic/bold
Locus and alleles
Meloria
Meloria
Vada
Vada
Follonica
Follonica
A
S
A
S
A
S
Poc-5
.176
0.000
0.000
0.000
0.000
0.000
0.000
.173
1.000
1.000
1.000
1.000
1.000
1.000
Poc-Z6
.289
0.000
0.000
0.000
0.059
0.000
0.000
.282
1.000
1.000
1.000
0.941
1.000
LOOO
.275
0.000
0.000
0.000
0.000
0.000
0.000
Poc-35
.206
0.000
0.000
0.000
0.000
0.000
0.048
.200
0.643
0.600
0.545
0.618
0.706
0.643
.197
0.036
0.000
0.000
0.000
0.000
0.048
.194
0.286
0.400
0.455
0.382
Q.294
0.262
.191
0.000
0.000
0.000
0.000
0.000
0.000
.185
0.036
0.000
0.000
0.000
0.000
0.000
Poc-42
.176
0.107
0.350
0.318
0.294
0.206
0.375
.170
0.893
0.650
0.682
0.706
0.794
0.625
Poc-45
.168
0.679
0.450
0.091
0.265
0.471
0.525
.165
0.000
0.000
0.045
0.000
0.000
0.000
.144
0.321
0.550
0.864
0.735
0.529
0.475
Poc-trn
.409
0.571
0.450
0.182
0.442
0.412
0.150
.401
0.000
0.050
0.000
0.000
0.000
0.000
.395
0.429
0.500
0.818
0.558
0.588
0.250
types, some of which were shared by more than
The mean value of tJ and Rho calculated for
one population. The GIN values for individual alilod were positive and significantly different
populations (expression of the percentage of new from zero, showing the existence of low but siggenotypes within a population) ranged from nificant genetic differentiation among the six
0.275 in Vada A (11 genotypes) to 0.60 in Vada S populations (Table 3). The existence of gene flow
(17 genotypes; Fig. 1). The number of unique was evidentiated by the two estimates of the
genotypes varied in the six populations (Fig. 1), mean number of migrants per generation (Nm iJ
with the higher values in Follonica S.
and Nm AAo ) that were higher than I, considered
Table 2. Genetic variation averaged over six micro satellite loci in the six Posidonia oceanica populations analysed
Population
Sample size
MeloriaA
36
MeloriaG
40
VadaA
40
VadaG
28
FollonicaA
39
Folloniga G
36
.. for nuclear loci only
# distinct genotypes
Mean number of
Percentage of
Expected
allels per locus
polymorphic loci
heterozygosity""
14
2.0 ± 0.5
0.6
0.234 ± 0.110
20
1.6 ± 0.2
0.6
0.293 ± 0.120
11
1.8 ± 0.4
0.6
0.246 ± 0.109
17
1.8 ± 0.2
0.8
0.286 ± 0.096
17
1.6 ± 0.2
0.6
0.256 ± 0.108
20
1.8 ± 0.4
0.6
0.294 ± 0.120
Table 3. Estimates off. F. for nuclear loci and of tJ, Rho, Nm" and NmRh° for alliod in the
six Posidonia oceanica populations
f(std.dev.)
F (std. dev.)
8 (std. dev.)
Rho (SE)
0.490 (0.154)
0.496 (0.129)
0.036 (0.031)
0.243 (0.004)
6.69
1.812
387
Table 1. Allele frequencies for the six microsatellite loci analysed. For sequence and size of microsateIHte regions see Procaccini
and Waycott (1998). The monomorphic Poc-5 locus has been included in the analysis to allow comparison with published data
(Procaccini and Mazzella 1998). Private alleles are in italic/bold
Locus and alleles
Meloria
Meloria
Vada
Vada
Follonica
Follonica
A
S
A
S
A
S
Poc-5
.176
0.000
0.000
0.000
0.000
0.000
0.000
.173
1.000
1.000
1.000
1.000
1.000
1.000
Poc-Z6
.289
0.000
0.000
0.000
0.059
0.000
0.000
.282
1.000
1.000
1.000
0.941
1.000
LOOO
.275
0.000
0.000
0.000
0.000
0.000
0.000
Poc-35
.206
0.000
0.000
0.000
0.000
0.000
0.048
.200
0.643
0.600
0.545
0.618
0.706
0.643
.197
0.036
0.000
0.000
0.000
0.000
0.048
.194
0.286
0.400
0.455
0.382
Q.294
0.262
.191
0.000
0.000
0.000
0.000
0.000
0.000
.185
0.036
0.000
0.000
0.000
0.000
0.000
Poc-42
.176
0.107
0.350
0.318
0.294
0.206
0.375
.170
0.893
0.650
0.682
0.706
0.794
0.625
Poc-45
.168
0.679
0.450
0.091
0.265
0.471
0.525
.165
0.000
0.000
0.045
0.000
0.000
0.000
.144
0.321
0.550
0.864
0.735
0.529
0.475
Poc-trn
.409
0.571
0.450
0.182
0.442
0.412
0.150
.401
0.000
0.050
0.000
0.000
0.000
0.000
.395
0.429
0.500
0.818
0.558
0.588
0.250
types, some of which were shared by more than
The mean value of tJ and Rho calculated for
one population. The GIN values for individual alilod were positive and significantly different
populations (expression of the percentage of new from zero, showing the existence of low but siggenotypes within a population) ranged from nificant genetic differentiation among the six
0.275 in Vada A (11 genotypes) to 0.60 in Vada S populations (Table 3). The existence of gene flow
(17 genotypes; Fig. 1). The number of unique was evidentiated by the two estimates of the
genotypes varied in the six populations (Fig. 1), mean number of migrants per generation (Nm iJ
with the higher values in Follonica S.
and Nm AAo ) that were higher than I, considered
Table 2. Genetic variation averaged over six micro satellite loci in the six Posidonia oceanica populations analysed
Population
Sample size
MeloriaA
36
MeloriaG
40
VadaA
40
VadaG
28
FollonicaA
39
Folloniga G
36
.. for nuclear loci only
# distinct genotypes
Mean number of
Percentage of
Expected
allels per locus
polymorphic loci
heterozygosity""
14
2.0 ± 0.5
0.6
0.234 ± 0.110
20
1.6 ± 0.2
0.6
0.293 ± 0.120
11
1.8 ± 0.4
0.6
0.246 ± 0.109
17
1.8 ± 0.2
0.8
0.286 ± 0.096
17
1.6 ± 0.2
0.6
0.256 ± 0.108
20
1.8 ± 0.4
0.6
0.294 ± 0.120
Table 3. Estimates off. F. for nuclear loci and of tJ, Rho, Nm" and NmRh° for alliod in the
six Posidonia oceanica populations
f(std.dev.)
F (std. dev.)
8 (std. dev.)
Rho (SE)
0.490 (0.154)
0.496 (0.129)
0.036 (0.031)
0.243 (0.004)
6.69
1.812