

356
M.A. Colangelo et ai.
er values of mean grain size (Table 1) in the
range of the "moderately sorted very coarse
sand" (Buchanan 1984).
Densities of the major taxa were low at the
two stations completely or partially covered by
colloidal sulphur (S16H and S16M) (Table 2).
Also at station SI6C, apparently devoid of sulphur deposits, total meiofaunal density resulted
to be significantly lower than those at S12M and
Sl2C (Table 3). No significant differences in
meiofaunal densities were observed between stations of the site S12 (Table 3). Copepods represented always the dominant taxon and, with the
exception of S16H and S16M, their average densities did not differ significantly among the other
stations (Table 3). At station S12e, nematode
densities were significantly lower than those at
stations with evident gas seepage, ie. S12H and
S12M (Table 3).
Number of species
:~ b
III
40~
·8 GI 30
D.
II)
a
a
~
20
10
0
:r:
:::i!:
u
:r:
:::i!:
u
N
N
N
to
to
to
(i)
..w (i) Q)
"......
(fJ
(fJ
Diversity
18
b
16
6
14
ab
ad
... 12
~ 1
!
ad
z 10
!
~
8
cd
:f
6
c
!
4
~
2
0
:r:
:::i!:
u
:r:
:::i!:
u
N
N
N
to
to
(0
Ui
Q)
.....
Q)
"......
..(fJ
CI)
(fJ
--~~--~~--~~--~~-Clustering and MDS plot of the jackknife
replicates of all stations (Fig. 2) showed a clear
distinctness of the copepod community structures, both between sites and, within sites,
among stations. These results were confirmed by
the ANOSIM global result (R=O.998. P
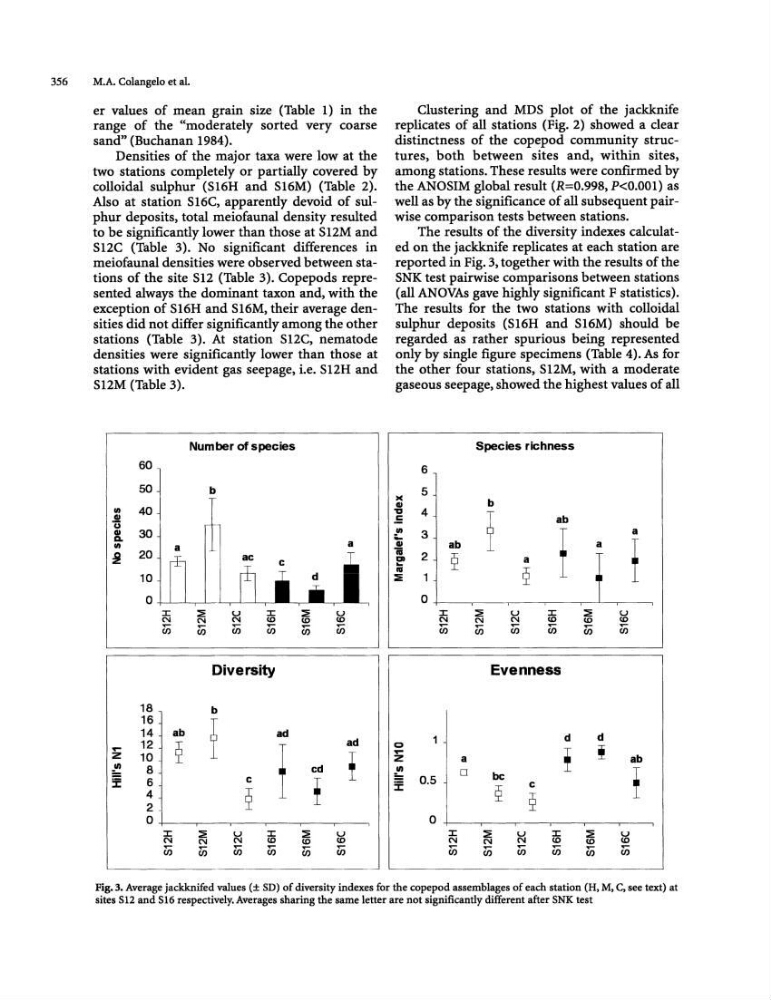
The results of the diversity indexes calculated on the jackknife replicates at each station are
reported in Fig. 3, together with the results of the
SNK test pairwise comparisons between stations
(all ANOVAs gave highly significant F statistics).
The results for the two stations with colloidal
sulphur deposits (SI6H and SI6M) should be
regarded as rather spurious being represented
only by single figure specimens (Table 4). As for
the other four stations, S12M. with a moderate
gaseous seepage. showed the highest values of all
Species richness
6
><
5
GI
b
-a
4
T
.=
ab
.11)
3
Y
!
a
- GI ab
a
f
iii
m
2
2
a
t
... IV
2
:::i!:
1
0
,
,
,
,
:r:
:::i!:
u
:r:
:::i!:
u
N
N
N
to
to
to
.-.....
(i)
.-."......
.-CI)
(fJ
CI)
CI)
CI)
Evenness
I
,
1
d
d
c
!
...
!
z
a
ab
III
0
f
== 0.5
1
be
:f
2
c
2
o I
,
,
,
,
,
,
:r:
:::!l:
u
:r:
:::!l:
u
N
N
N
to
to
(0
.-Ui
.....
.... ..- Ci.i
(fJ
(fJ
CI)
(fJ
Fig. 3. Average jackknifed values (± SD) of diversity indexes for the copepod assemblages of each station (H, M, C, see text) at
sites S12 and S16 respectively. Averages sharing the same letter are not significantly different after SNK test
M.A. Colangelo et ai.
er values of mean grain size (Table 1) in the
range of the "moderately sorted very coarse
sand" (Buchanan 1984).
Densities of the major taxa were low at the
two stations completely or partially covered by
colloidal sulphur (S16H and S16M) (Table 2).
Also at station SI6C, apparently devoid of sulphur deposits, total meiofaunal density resulted
to be significantly lower than those at S12M and
Sl2C (Table 3). No significant differences in
meiofaunal densities were observed between stations of the site S12 (Table 3). Copepods represented always the dominant taxon and, with the
exception of S16H and S16M, their average densities did not differ significantly among the other
stations (Table 3). At station S12e, nematode
densities were significantly lower than those at
stations with evident gas seepage, ie. S12H and
S12M (Table 3).
Number of species
:~ b
III
40~
·8 GI 30
D.
II)
a
a
~
20
10
0
:r:
:::i!:
u
:r:
:::i!:
u
N
N
N
to
to
to
(i)
..w (i) Q)
"......
(fJ
(fJ
Diversity
18
b
16
6
14
ab
ad
... 12
~ 1
!
ad
z 10
!
~
8
cd
:f
6
c
!
4
~
2
0
:r:
:::i!:
u
:r:
:::i!:
u
N
N
N
to
to
(0
Ui
Q)
.....
Q)
"......
..(fJ
CI)
(fJ
--~~--~~--~~--~~-Clustering and MDS plot of the jackknife
replicates of all stations (Fig. 2) showed a clear
distinctness of the copepod community structures, both between sites and, within sites,
among stations. These results were confirmed by
the ANOSIM global result (R=O.998. P
The results of the diversity indexes calculated on the jackknife replicates at each station are
reported in Fig. 3, together with the results of the
SNK test pairwise comparisons between stations
(all ANOVAs gave highly significant F statistics).
The results for the two stations with colloidal
sulphur deposits (SI6H and SI6M) should be
regarded as rather spurious being represented
only by single figure specimens (Table 4). As for
the other four stations, S12M. with a moderate
gaseous seepage. showed the highest values of all
Species richness
6
><
5
GI
b
-a
4
T
.=
ab
.11)
3
Y
!
a
- GI ab
a
f
iii
m
2
2
a
t
... IV
2
:::i!:
1
0
,
,
,
,
:r:
:::i!:
u
:r:
:::i!:
u
N
N
N
to
to
to
.-.....
(i)
.-."......
.-CI)
(fJ
CI)
CI)
CI)
Evenness
I
,
1
d
d
c
!
...
!
z
a
ab
III
0
f
== 0.5
1
be
:f
2
c
2
o I
,
,
,
,
,
,
:r:
:::!l:
u
:r:
:::!l:
u
N
N
N
to
to
(0
.-Ui
.....
.... ..- Ci.i
(fJ
(fJ
CI)
(fJ
Fig. 3. Average jackknifed values (± SD) of diversity indexes for the copepod assemblages of each station (H, M, C, see text) at
sites S12 and S16 respectively. Averages sharing the same letter are not significantly different after SNK test