

354
M.A. Colangelo et al.
tive fields each covering generally about a few
hundred square metres (Italiano and Nuccio
1991). They are recognisable by columns of
gaseous bubbles seeping from hard and sandy
substrates. The mean composition of the gas
mixture. measured from different seeps, is mainly 94.71 vol.% CO 2 and 1.96 vol.% HaS (max 6.5
vol.%).Also lesser percentages ofCH. and H2 are
present (Italiano and Nuccio 1991). Around
exhalative fields with higher H 2 S content, the
interactions of the gases with marine sulphates
and with dissolved oxygen in the sea-water give
rise to patches of white. snow-like colloidal sulphur deposits (Italiano and Nuccio 1991;
Gabbianelli et al. 1996). The present paper deals
with investigations on meiobenthos from this
hydrothermal area, with particular reference to
the biodiversity of the Copepod assemblages.
Materials and Methods
Underwater investigations were carried out in
two exhalative fields of the Panarea's caldera
characterised by different kinds of seepage. In
the study area two sites were marked as S12 and
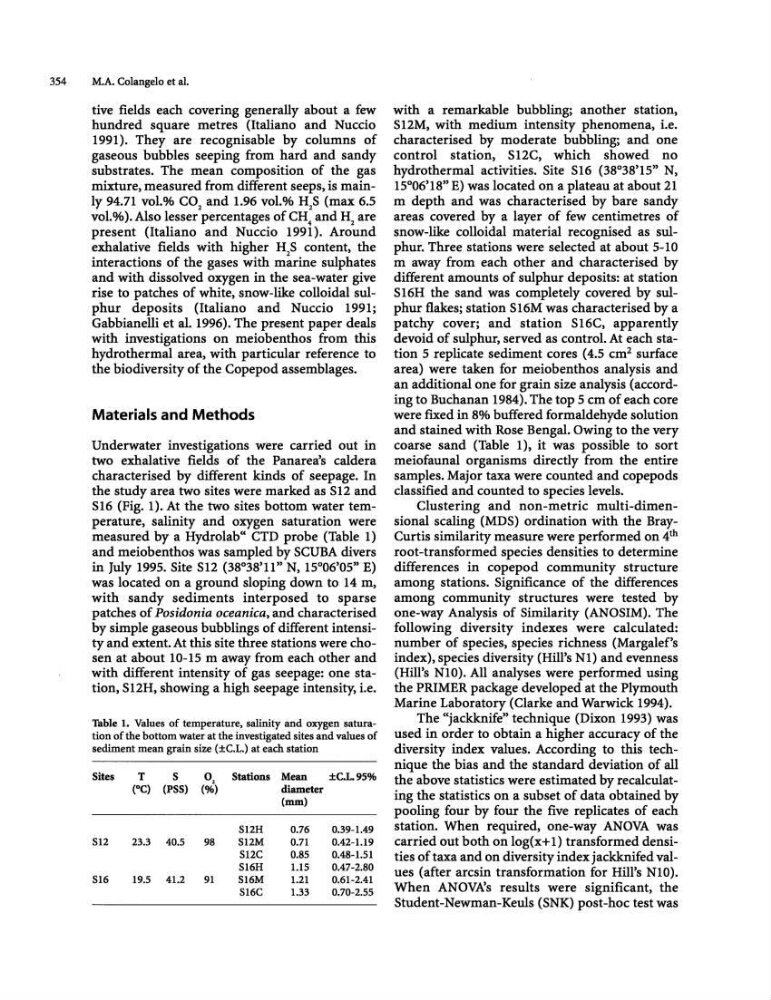
816 (Fig. 1). At the two sites bottom water temperature, salinity and oxygen saturation were
measured by a Hydrolab" CTD probe (Table 1)
and meiobenthos was sampled by SCUBA divers
in July 1995. Site S12 (38°38'11" N, 15°06'05" E)
was located on a ground sloping down to 14 m,
with sandy sediments interposed to sparse
patches of Posidonia oceanica, and characterised
by simple gaseous bubblings of different intensity and extent. At this site three stations were chosen at about 10-15 m away from each other and
with different intensity of gas seepage: one station, S12H. showing a high seepage intensity, i.e.
Table 1. Values of temperature, salinity and oxygen saturation of the bottom water at the investigated sites and values of
sediment mean grain size (±C.L.) at each station
Sites
T
S
0,
Stations Mean
±C.L. 95%
(0C) (PSS) (%)
diameter
(rom)
S12H
0.76
0.39-1.49
S12
23.3 40.5
98
S12M
0.71
0.42-1.19
Sl2C
0.85
0.48-1.51
S16H
1.15
0.47-2.80
516
19.5 41.2
91
S16M
1.21
0.61-2.41
S16C
1.33
0.70-2.55
with a remarkable bubbling; another station,
S12M, with medium intensity phenomena, i.e.
characterised by moderate bubbling; and one
control station, Sl2C, which showed no
hydrothermal activities. Site S16 (38°38'15" N,
15°06'18" E) was located on a plateau at about 21
m depth and was characterised by bare sandy
areas covered by a layer of few centimetres of
snow-like colloidal material recognised as sulphur. Three stations were selected at about 5-10
m away from each other and characterised by
different amounts of sulphur deposits: at station
S16H the sand was completely covered by sulphur flakes; station S16M was characterised by a
patchy cover; and station S 16C. apparently
devoid of sulphur, served as control. At each station 5 replicate sediment cores (4.5 cm 2 surface
area) were taken for meiobenthos analysis and
an additional one for grain size analysis (according to Buchanan 1984). The top 5 cm of each core
were ftxed in 8% buffered formaldehyde solution
and stained with Rose Bengal. Owing to the very
coarse sand (Table 1), it was possible to sort
meiofaunal organisms directly from the entire
samples. Major taxa were counted and copepods
classified and counted to species levels.
Clustering and non-metric multi-dimensional scaling (MDS) ordination with the BrayCurtis similarity measure were performed on 4th
root-transformed species densities to determine
differences in copepod community structure
among stations. Significance of the differences
among community structures were tested by
one-way Analysis of Similarity (ANOSIM). The
following diversity indexes were calculated:
number of species, species richness (Margalef's
index), species diversity (Hill's N1) and evenness
(Hill's N10). All analyses were performed using
the PRIMER package developed at the Plymouth
Marine Laboratory (Clarke and Warwick 1994).
The "jackknife" technique (Dixon 1993) was
used in order to obtain a higher accuracy of the
diversity index values. According to this technique the bias and the standard deviation of all
the above statistics were estimated by recalculating the statistics on a subset of data obtained by
pooling four by four the five replicates of each
station. When required, one-way ANOVA was
carried out both on log(x+ 1) transformed densities of taxa and on diversity index jackknifed values (after arcsin transformation for Hill's N10).
When ANOVA's results were significant, the
Student-Newman-Keuls (SNK) post-hoc test was
M.A. Colangelo et al.
tive fields each covering generally about a few
hundred square metres (Italiano and Nuccio
1991). They are recognisable by columns of
gaseous bubbles seeping from hard and sandy
substrates. The mean composition of the gas
mixture. measured from different seeps, is mainly 94.71 vol.% CO 2 and 1.96 vol.% HaS (max 6.5
vol.%).Also lesser percentages ofCH. and H2 are
present (Italiano and Nuccio 1991). Around
exhalative fields with higher H 2 S content, the
interactions of the gases with marine sulphates
and with dissolved oxygen in the sea-water give
rise to patches of white. snow-like colloidal sulphur deposits (Italiano and Nuccio 1991;
Gabbianelli et al. 1996). The present paper deals
with investigations on meiobenthos from this
hydrothermal area, with particular reference to
the biodiversity of the Copepod assemblages.
Materials and Methods
Underwater investigations were carried out in
two exhalative fields of the Panarea's caldera
characterised by different kinds of seepage. In
the study area two sites were marked as S12 and
816 (Fig. 1). At the two sites bottom water temperature, salinity and oxygen saturation were
measured by a Hydrolab" CTD probe (Table 1)
and meiobenthos was sampled by SCUBA divers
in July 1995. Site S12 (38°38'11" N, 15°06'05" E)
was located on a ground sloping down to 14 m,
with sandy sediments interposed to sparse
patches of Posidonia oceanica, and characterised
by simple gaseous bubblings of different intensity and extent. At this site three stations were chosen at about 10-15 m away from each other and
with different intensity of gas seepage: one station, S12H. showing a high seepage intensity, i.e.
Table 1. Values of temperature, salinity and oxygen saturation of the bottom water at the investigated sites and values of
sediment mean grain size (±C.L.) at each station
Sites
T
S
0,
Stations Mean
±C.L. 95%
(0C) (PSS) (%)
diameter
(rom)
S12H
0.76
0.39-1.49
S12
23.3 40.5
98
S12M
0.71
0.42-1.19
Sl2C
0.85
0.48-1.51
S16H
1.15
0.47-2.80
516
19.5 41.2
91
S16M
1.21
0.61-2.41
S16C
1.33
0.70-2.55
with a remarkable bubbling; another station,
S12M, with medium intensity phenomena, i.e.
characterised by moderate bubbling; and one
control station, Sl2C, which showed no
hydrothermal activities. Site S16 (38°38'15" N,
15°06'18" E) was located on a plateau at about 21
m depth and was characterised by bare sandy
areas covered by a layer of few centimetres of
snow-like colloidal material recognised as sulphur. Three stations were selected at about 5-10
m away from each other and characterised by
different amounts of sulphur deposits: at station
S16H the sand was completely covered by sulphur flakes; station S16M was characterised by a
patchy cover; and station S 16C. apparently
devoid of sulphur, served as control. At each station 5 replicate sediment cores (4.5 cm 2 surface
area) were taken for meiobenthos analysis and
an additional one for grain size analysis (according to Buchanan 1984). The top 5 cm of each core
were ftxed in 8% buffered formaldehyde solution
and stained with Rose Bengal. Owing to the very
coarse sand (Table 1), it was possible to sort
meiofaunal organisms directly from the entire
samples. Major taxa were counted and copepods
classified and counted to species levels.
Clustering and non-metric multi-dimensional scaling (MDS) ordination with the BrayCurtis similarity measure were performed on 4th
root-transformed species densities to determine
differences in copepod community structure
among stations. Significance of the differences
among community structures were tested by
one-way Analysis of Similarity (ANOSIM). The
following diversity indexes were calculated:
number of species, species richness (Margalef's
index), species diversity (Hill's N1) and evenness
(Hill's N10). All analyses were performed using
the PRIMER package developed at the Plymouth
Marine Laboratory (Clarke and Warwick 1994).
The "jackknife" technique (Dixon 1993) was
used in order to obtain a higher accuracy of the
diversity index values. According to this technique the bias and the standard deviation of all
the above statistics were estimated by recalculating the statistics on a subset of data obtained by
pooling four by four the five replicates of each
station. When required, one-way ANOVA was
carried out both on log(x+ 1) transformed densities of taxa and on diversity index jackknifed values (after arcsin transformation for Hill's N10).
When ANOVA's results were significant, the
Student-Newman-Keuls (SNK) post-hoc test was