

Variability in a Bathyal Community
Table 2a,b. a 1981, and b 1996, characterising species: numerical dominance in respect of
the phylum to which they belong and of the whole community
a
Phylum
Polychaetes
Crustaceans
Molluscs
Echinoderms
Other taxa
b
Phylum
Polychaetes
Crustaceans
Molluscs
Echinoderms
Other taxa
The analysis of biocoenotical assemblages
dominance evidenced only a slight increase of
VP characteristic species, although remarkable
absences may be stressed, such as the ophiuroid
limivores
7%
suspensionfeeders 7%
depositfeeders 68%
camivores
16%
1981
% on phylum
%oDwhole
community
Anobothrus gracilis
12.9
6.6
Melinna monoceroides
10.3
5.3
Spiophanes hoyeri rejssi
10.3
5.3
Calocaris macandreae
27.2
4.8
Eriopisa elongata
19.8
3.5
Abra longicallus
42.4
3.1
Lionucula tenuis aegeensis
18.2
1.3
Thracia papyracea
15.2
1.1
Amphilepis norvegica
57.3
10.3
Amphiura filiformis
24.4
4.4
Aspidosiphon mulleri
53.S
3.1
1996
% on phylum
% on whole
community
Aricidea quadrilobata
11.5
3.5
Onuphis lepta
11.5
3.5
Prionospio cirrifera
10.8
3.3
Anthelura fresi
14.0
1.5
Calocaris macandreae
12.0
1.3
Eriopisa elongata
20.0
2.2
Abra longicallus
36.8
1.5
Dentalium agilis
15.8
0.7
Molpadia musculus
100
1.3
Onchnesoma steenstrupi
20.0
1.3
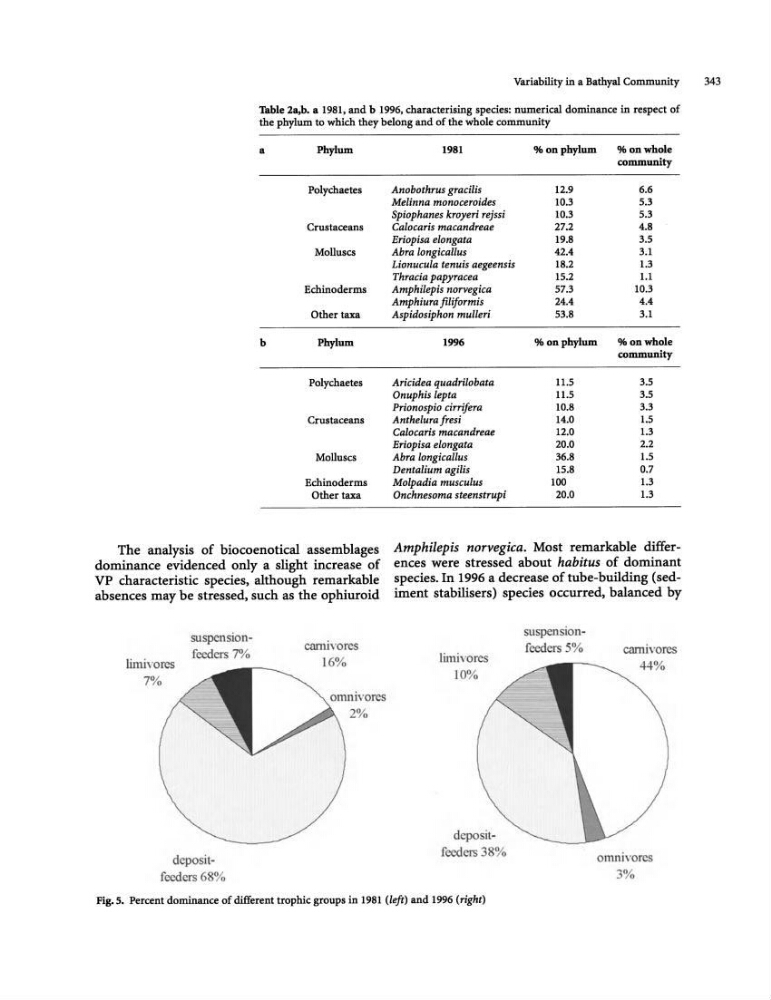
Amphilepis norvegica. Most remarkable differences were stressed about habitus of dominant
species. In 1996 a decrease of tube-building (sediment stabilisers) species occurred, balanced by
limivores
10%
depositfeeders 38%
suspensionfeeders 5%
cam.ivores
44%
omnivores
3%
Fig.s. Percent dominance of different trophic groups in 1981 (left) and 1996 (right)
343
Table 2a,b. a 1981, and b 1996, characterising species: numerical dominance in respect of
the phylum to which they belong and of the whole community
a
Phylum
Polychaetes
Crustaceans
Molluscs
Echinoderms
Other taxa
b
Phylum
Polychaetes
Crustaceans
Molluscs
Echinoderms
Other taxa
The analysis of biocoenotical assemblages
dominance evidenced only a slight increase of
VP characteristic species, although remarkable
absences may be stressed, such as the ophiuroid
limivores
7%
suspensionfeeders 7%
depositfeeders 68%
camivores
16%
1981
% on phylum
%oDwhole
community
Anobothrus gracilis
12.9
6.6
Melinna monoceroides
10.3
5.3
Spiophanes hoyeri rejssi
10.3
5.3
Calocaris macandreae
27.2
4.8
Eriopisa elongata
19.8
3.5
Abra longicallus
42.4
3.1
Lionucula tenuis aegeensis
18.2
1.3
Thracia papyracea
15.2
1.1
Amphilepis norvegica
57.3
10.3
Amphiura filiformis
24.4
4.4
Aspidosiphon mulleri
53.S
3.1
1996
% on phylum
% on whole
community
Aricidea quadrilobata
11.5
3.5
Onuphis lepta
11.5
3.5
Prionospio cirrifera
10.8
3.3
Anthelura fresi
14.0
1.5
Calocaris macandreae
12.0
1.3
Eriopisa elongata
20.0
2.2
Abra longicallus
36.8
1.5
Dentalium agilis
15.8
0.7
Molpadia musculus
100
1.3
Onchnesoma steenstrupi
20.0
1.3
Amphilepis norvegica. Most remarkable differences were stressed about habitus of dominant
species. In 1996 a decrease of tube-building (sediment stabilisers) species occurred, balanced by
limivores
10%
depositfeeders 38%
suspensionfeeders 5%
cam.ivores
44%
omnivores
3%
Fig.s. Percent dominance of different trophic groups in 1981 (left) and 1996 (right)
343