

320
G. Mancinelli et al.
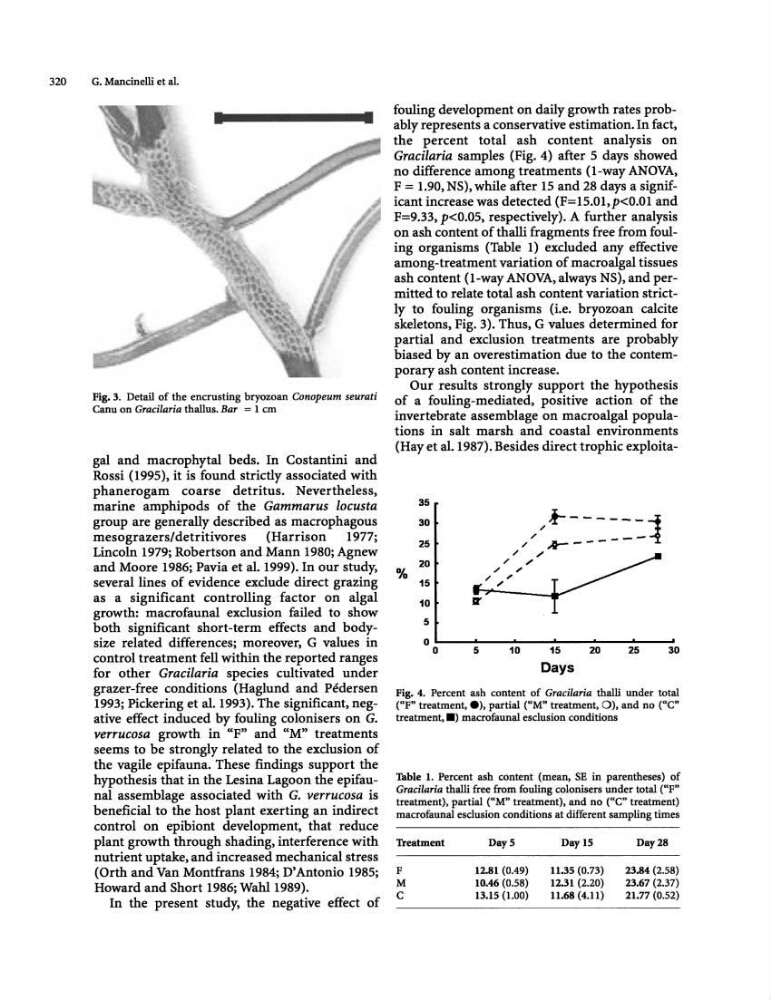
Fig. 3. Detail of the encrusting bryozoan Conopeum seurati
Canu on Gracilaria thallus. Bar = 1 cm
gal and macrophytal beds. In Costantini and
Rossi (1995), it is found strictly associated with
phanerogam coarse detritus. Nevertheless,
marine amphipods of the Gammarus locusta
group are generally described as macrophagous
mesograzers/detritivores (Harrison 1977;
Lincoln 1979; Robertson and Mann 1980; Agnew
and Moore 1986; Pavia et al. 1999). In our study,
several lines of evidence exclude direct grazing
as a significant controlling factor on algal
growth: macrofaunal exclusion failed to show
both significant short-term effects and bodysize related differences; moreover, G values in
control treatment fell within the reported ranges
for other Gracilaria species cultivated under
grazer-free conditions (Haglund and Pedersen
1993; Pickering et al. 1993). The significant, negative effect induced by fouling colonisers on G.
verrucosa growth in "F" and "M" treatments
seems to be strongly related to the exclusion of
the vagile epifauna. These findings support the
hypothesis that in the Lesina Lagoon the epifaunal assemblage associated with G. verrucosa is
beneficial to the host plant exerting an indirect
control on epibiont development, that reduce
plant growth through shading, interference with
nutrient uptake, and increased mechanical stress
(Orth and Van Montfrans 1984; D'Antonio 1985;
Howard and Short 1986; Wahl 1989).
In the present study, the negative effect of
fouling development on daily growth rates probably represents a conservative estimation. In fact,
the percent total ash content analysis on
Gracilaria samples (Fig. 4) after 5 days showed
no difference among treatments (I-way ANOVA,
F = 1.90, NS), while after 15 and 28 days a significant increase was detected (F=15.01,p<0.0l and
F=9.33, p
among-treatment variation of macroalgal tissues
ash content (I-way ANOVA, always NS), and permitted to relate total ash content variation strictly to fouling organisms (Le. bryozoan calcite
skeletons, Fig. 3). Thus, G values determined for
partial and exclusion treatments are probably
biased by an overestimation due to the contemporary ash content increase.
Our results strongly support the hypothesis
of a fouling-mediated, positive action of the
invertebrate assemblage on macro algal populations in salt marsh and coastal environments
(Hay et al. 1987). Besides direct trophic exploita%
35
30
25
20
15
10
Ir
5
"..t-------1
/
--"
..0---" "
" "
./
'"
" ",'"
o ~--~----~--~----~----~--~
o
5
10
15
Days
20
25
30
Fig. 4. Percent ash content of Gracilaria thalli under total
("F" treatment, e), partial ("M" treatment, 0), and no ("'C"
treatment,.) macrofaunal esclusion conditions
Table 1. Percent ash content (mean, SE in parentheses) of
Gracilaria thalli free from fouling colonisers under total ("P"
treatment), partial ("M" treatment), and no (Ue" treatment)
macrofaunal esclusion conditions at different sampling times
lreatment
F
M
C
DayS
12.81 (0.49)
10.46 (0.58)
13.15 (l.00)
Day 15
11.35 (0.73)
12.31 (2.20)
11.68 (4.11)
Day 28
23.84 (2.58)
23.67 (2.37)
21.77 (0.52)
G. Mancinelli et al.
Fig. 3. Detail of the encrusting bryozoan Conopeum seurati
Canu on Gracilaria thallus. Bar = 1 cm
gal and macrophytal beds. In Costantini and
Rossi (1995), it is found strictly associated with
phanerogam coarse detritus. Nevertheless,
marine amphipods of the Gammarus locusta
group are generally described as macrophagous
mesograzers/detritivores (Harrison 1977;
Lincoln 1979; Robertson and Mann 1980; Agnew
and Moore 1986; Pavia et al. 1999). In our study,
several lines of evidence exclude direct grazing
as a significant controlling factor on algal
growth: macrofaunal exclusion failed to show
both significant short-term effects and bodysize related differences; moreover, G values in
control treatment fell within the reported ranges
for other Gracilaria species cultivated under
grazer-free conditions (Haglund and Pedersen
1993; Pickering et al. 1993). The significant, negative effect induced by fouling colonisers on G.
verrucosa growth in "F" and "M" treatments
seems to be strongly related to the exclusion of
the vagile epifauna. These findings support the
hypothesis that in the Lesina Lagoon the epifaunal assemblage associated with G. verrucosa is
beneficial to the host plant exerting an indirect
control on epibiont development, that reduce
plant growth through shading, interference with
nutrient uptake, and increased mechanical stress
(Orth and Van Montfrans 1984; D'Antonio 1985;
Howard and Short 1986; Wahl 1989).
In the present study, the negative effect of
fouling development on daily growth rates probably represents a conservative estimation. In fact,
the percent total ash content analysis on
Gracilaria samples (Fig. 4) after 5 days showed
no difference among treatments (I-way ANOVA,
F = 1.90, NS), while after 15 and 28 days a significant increase was detected (F=15.01,p<0.0l and
F=9.33, p
among-treatment variation of macroalgal tissues
ash content (I-way ANOVA, always NS), and permitted to relate total ash content variation strictly to fouling organisms (Le. bryozoan calcite
skeletons, Fig. 3). Thus, G values determined for
partial and exclusion treatments are probably
biased by an overestimation due to the contemporary ash content increase.
Our results strongly support the hypothesis
of a fouling-mediated, positive action of the
invertebrate assemblage on macro algal populations in salt marsh and coastal environments
(Hay et al. 1987). Besides direct trophic exploita%
35
30
25
20
15
10
Ir
5
"..t-------1
/
--"
..0---" "
" "
./
'"
" ",'"
o ~--~----~--~----~----~--~
o
5
10
15
Days
20
25
30
Fig. 4. Percent ash content of Gracilaria thalli under total
("F" treatment, e), partial ("M" treatment, 0), and no ("'C"
treatment,.) macrofaunal esclusion conditions
Table 1. Percent ash content (mean, SE in parentheses) of
Gracilaria thalli free from fouling colonisers under total ("P"
treatment), partial ("M" treatment), and no (Ue" treatment)
macrofaunal esclusion conditions at different sampling times
lreatment
F
M
C
DayS
12.81 (0.49)
10.46 (0.58)
13.15 (l.00)
Day 15
11.35 (0.73)
12.31 (2.20)
11.68 (4.11)
Day 28
23.84 (2.58)
23.67 (2.37)
21.77 (0.52)