

12
G. Budillon et al.
Results and Discussion
The Vertical Structure
In the summer period, the solar heating affects
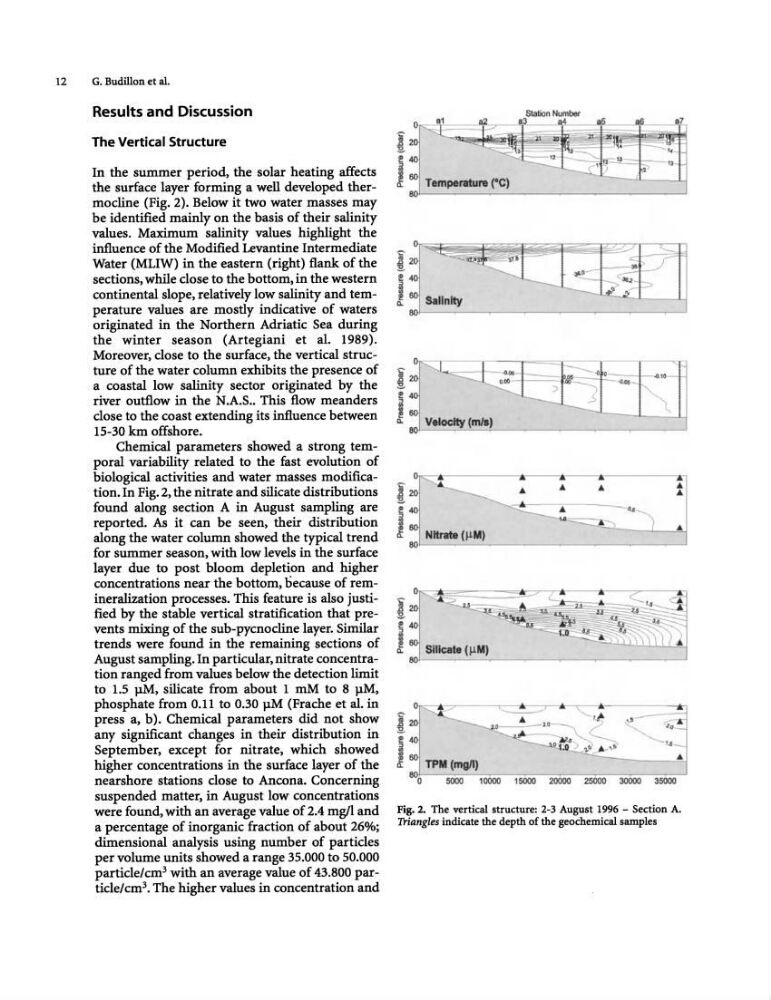
the surface layer forming a well developed thermocline (Fig. 2). Below it two water masses may
be identified mainly on the basis of their salinity
values. Maximum salinity values highlight the
influence of the Modified Levantine Intermediate
Water (MLIW) in the eastern (right) flank of the
sections, while dose to the bottom, in the western
continental slope, relatively low salinity and temperature values are mostly indicative of waters
originated in the Northern Adriatic Sea during
the winter season (Artegiani et al. 1989).
Moreover, dose to the surface, the vertical structure of the water column exhibits the presence of
a coastal low salinity sector originated by the
river outflow in the N.A.S .. This flow meanders
close to the coast extending its influence between
15-30 km offshore.
Chemical parameters showed a strong temporal variability related to the fast evolution of
biological activities and water masses modification. In Fig. 2, the nitrate and silicate distributions
found along section A in August sampling are
reported. As it can be seen, their distribution
along the water column showed the typical trend
for summer season, with low levels in the surface
layer due to post bloom depletion and higher
concentrations near the bottom, because of remineralization processes. This feature is also justified by the stable vertical stratification that prevents mixing of the sub-pycnocline layer. Similar
trends were found in the remaining sections of
August sampling. In particular, nitrate concentration ranged from values below the detection limit
to 1.5 JIM, silicate from about 1 mM to 8 pM,
phosphate from 0.11 to 0.30 JIM (Frache et al. in
press a, b). Chemical parameters did not show
any significant changes in their distribution in
September, except for nitrate, which showed
higher concentrations in the surface layer of the
nearshore stations dose to Ancona. Concerning
suspended matter, in August low concentrations
were found, with an average value of 2.4 mg/l and
a percentage of inorganic fraction of about 26%;
dimensional analysis using number of particles
per volume units showed a range 35.000 to 50.000
partide/cm 3 with an average value of 43.800 partide/cm 3 • The higher values in concentration and
j
~
I Salinity
8~--~~--~--------~--~--~----~~
~~~--------~----'-----&---------.n
j2
~
t!! 40
a!
I. 60 TPM (mgll)
~
BOO
5000
10000
15000 20000
25000 30000 35000
... ...
Fig. 2. The vertical structure: 2-3 August 1996 - Section A.
Triangles indicate the depth of the geochemical samples
G. Budillon et al.
Results and Discussion
The Vertical Structure
In the summer period, the solar heating affects
the surface layer forming a well developed thermocline (Fig. 2). Below it two water masses may
be identified mainly on the basis of their salinity
values. Maximum salinity values highlight the
influence of the Modified Levantine Intermediate
Water (MLIW) in the eastern (right) flank of the
sections, while dose to the bottom, in the western
continental slope, relatively low salinity and temperature values are mostly indicative of waters
originated in the Northern Adriatic Sea during
the winter season (Artegiani et al. 1989).
Moreover, dose to the surface, the vertical structure of the water column exhibits the presence of
a coastal low salinity sector originated by the
river outflow in the N.A.S .. This flow meanders
close to the coast extending its influence between
15-30 km offshore.
Chemical parameters showed a strong temporal variability related to the fast evolution of
biological activities and water masses modification. In Fig. 2, the nitrate and silicate distributions
found along section A in August sampling are
reported. As it can be seen, their distribution
along the water column showed the typical trend
for summer season, with low levels in the surface
layer due to post bloom depletion and higher
concentrations near the bottom, because of remineralization processes. This feature is also justified by the stable vertical stratification that prevents mixing of the sub-pycnocline layer. Similar
trends were found in the remaining sections of
August sampling. In particular, nitrate concentration ranged from values below the detection limit
to 1.5 JIM, silicate from about 1 mM to 8 pM,
phosphate from 0.11 to 0.30 JIM (Frache et al. in
press a, b). Chemical parameters did not show
any significant changes in their distribution in
September, except for nitrate, which showed
higher concentrations in the surface layer of the
nearshore stations dose to Ancona. Concerning
suspended matter, in August low concentrations
were found, with an average value of 2.4 mg/l and
a percentage of inorganic fraction of about 26%;
dimensional analysis using number of particles
per volume units showed a range 35.000 to 50.000
partide/cm 3 with an average value of 43.800 partide/cm 3 • The higher values in concentration and
j
~
I Salinity
8~--~~--~--------~--~--~----~~
~~~--------~----'-----&---------.n
j2
~
t!! 40
a!
I. 60 TPM (mgll)
~
BOO
5000
10000
15000 20000
25000 30000 35000
... ...
Fig. 2. The vertical structure: 2-3 August 1996 - Section A.
Triangles indicate the depth of the geochemical samples