

274
P. Di Dato et al.
very low values. However, the overall degree of
matching of each partition with Vatova's
zoocoenoses was expressed according to a relative scale, where a unit value indicated a perfect
matching. This "matching index" was obtained
dividing the sum of the deviations from the
expected frequencies of the matched zoocoenosis/cluster pairs by the value that would have
been obtained in the case of perfect matching
(i.e. comparing Vatova's zoocoenoses with themselves). It should be stressed that this index takes
into account the effect of the number of items in
each cluster when evaluating the degree of
matching to the original classification, whereas
the raw number of matches does not.
Results and Discussion
The comparison of the results of the different
clustering procedures with the Vatova's
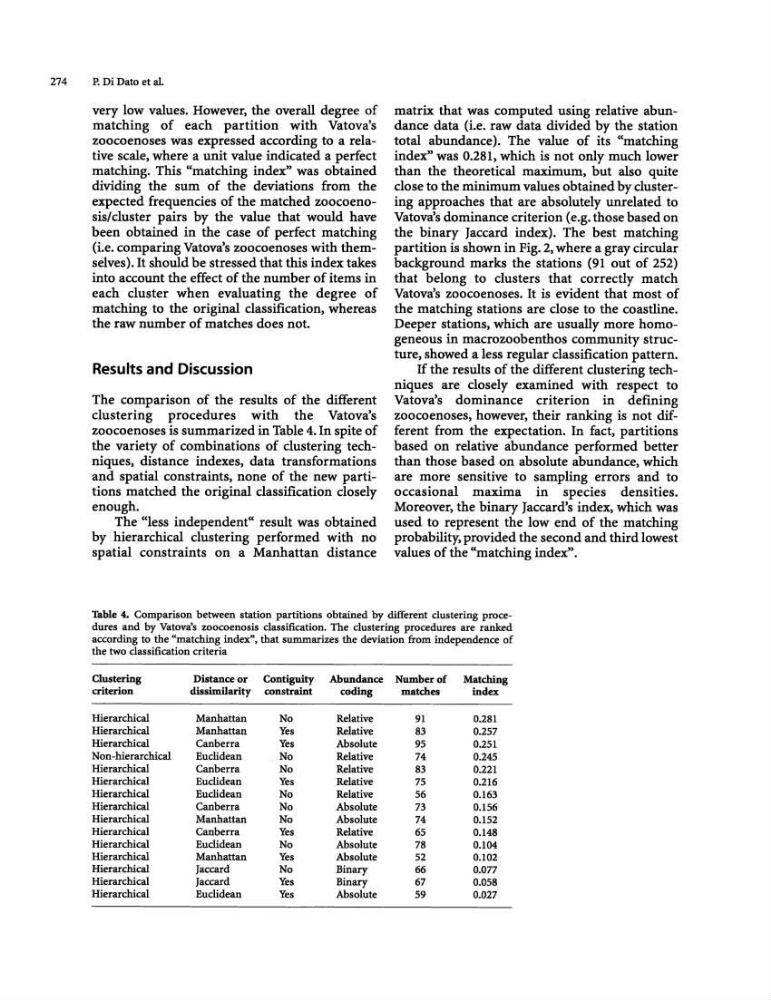
zoocoenoses is summarized in Table 4. In spite of
the variety of combinations of clustering techniques, distance indexes, data transformations
and spatial constraints, none of the new partitions matched the original classification closely
enough.
The "less independent« result was obtained
by hierarchical clustering performed with no
spatial constraints on a Manhattan distance
matrix that was computed using relative abundance data (i.e. raw data divided by the station
total abundance). The value of its "'matching
index" was 0.281, which is not only much lower
than the theoretical maximum, but also quite
dose to the minimum values obtained by clustering approaches that are absolutely unrelated to
Vatova's dominance criterion (e.g. those based on
the binary Jaccard index), The best matching
partition is shown in Fig. 2, where a gray circular
background marks the stations (91 out of 252)
that belong to dusters that correctly match
Vatova's zoocoenoses. It is evident that most of
the matching stations are close to the coastline.
Deeper stations, which are usually more homogeneous in macrozoobenthos community structure, showed a less regular classification pattern.
If the results of the different clustering techniques are closely examined with respect to
Vatova's dominance criterion in defining
zoocoenoses, however, their ranking is not different from the expectation. In fact, partitions
based on relative abundance performed better
than those based on absolute abundance, which
are more sensitive to sampling errors and to
occasional maxima in species densities.
Moreover, the binary Jaccard's index, which was
used to represent the low end of the matching
probability. provided the second and third lowest
values of the "matching index".
1ilble 4. Comparison between station partitions obtained by different clustering procedures and by Vatova's zoocoenosis classification. The clustering procedures are ranked
according to the "matching index", that summarizes the deviation from independence of
the two classification criteria
Clustering
Distance or Contiguity Abundance Number of Matching
criterion
dissimilarity constraint
coding
matches
index
Hierarchical
Manhattan
No
Relative
91
0.281
Hierarchical
Manhattan
Yes
Relative
83
0.257
Hierarchical
Canberra
Yes
Absolute
95
0.251
Non-hierarchical
Euclidean
No
Relative
74
0.245
Hierarchical
Canberra
No
Relative
83
0.221
Hierarchical
Euclidean
Yes
Relative
75
0.216
Hierarchical
Euclidean
No
Relative
56
0.163
Hierarchical
Canberra
No
Absolute
73
0.156
Hierarchical
Manhattan
No
Absolute
74
0.152
Hierarchical
Canberra
Yes
Relative
65
0.148
Hierarchical
Euclidean
No
Absolute
78
0.104
Hierarchical
Manhattan
Yes
Absolute
52
0.102
Hierarchical
Jaccard
No
Binary
66
0.077
Hierarchical
Jaccard
Yes
Binary
67
0.058
Hierarchical
Euclidean
Yes
Absolute
59
0.027
P. Di Dato et al.
very low values. However, the overall degree of
matching of each partition with Vatova's
zoocoenoses was expressed according to a relative scale, where a unit value indicated a perfect
matching. This "matching index" was obtained
dividing the sum of the deviations from the
expected frequencies of the matched zoocoenosis/cluster pairs by the value that would have
been obtained in the case of perfect matching
(i.e. comparing Vatova's zoocoenoses with themselves). It should be stressed that this index takes
into account the effect of the number of items in
each cluster when evaluating the degree of
matching to the original classification, whereas
the raw number of matches does not.
Results and Discussion
The comparison of the results of the different
clustering procedures with the Vatova's
zoocoenoses is summarized in Table 4. In spite of
the variety of combinations of clustering techniques, distance indexes, data transformations
and spatial constraints, none of the new partitions matched the original classification closely
enough.
The "less independent« result was obtained
by hierarchical clustering performed with no
spatial constraints on a Manhattan distance
matrix that was computed using relative abundance data (i.e. raw data divided by the station
total abundance). The value of its "'matching
index" was 0.281, which is not only much lower
than the theoretical maximum, but also quite
dose to the minimum values obtained by clustering approaches that are absolutely unrelated to
Vatova's dominance criterion (e.g. those based on
the binary Jaccard index), The best matching
partition is shown in Fig. 2, where a gray circular
background marks the stations (91 out of 252)
that belong to dusters that correctly match
Vatova's zoocoenoses. It is evident that most of
the matching stations are close to the coastline.
Deeper stations, which are usually more homogeneous in macrozoobenthos community structure, showed a less regular classification pattern.
If the results of the different clustering techniques are closely examined with respect to
Vatova's dominance criterion in defining
zoocoenoses, however, their ranking is not different from the expectation. In fact, partitions
based on relative abundance performed better
than those based on absolute abundance, which
are more sensitive to sampling errors and to
occasional maxima in species densities.
Moreover, the binary Jaccard's index, which was
used to represent the low end of the matching
probability. provided the second and third lowest
values of the "matching index".
1ilble 4. Comparison between station partitions obtained by different clustering procedures and by Vatova's zoocoenosis classification. The clustering procedures are ranked
according to the "matching index", that summarizes the deviation from independence of
the two classification criteria
Clustering
Distance or Contiguity Abundance Number of Matching
criterion
dissimilarity constraint
coding
matches
index
Hierarchical
Manhattan
No
Relative
91
0.281
Hierarchical
Manhattan
Yes
Relative
83
0.257
Hierarchical
Canberra
Yes
Absolute
95
0.251
Non-hierarchical
Euclidean
No
Relative
74
0.245
Hierarchical
Canberra
No
Relative
83
0.221
Hierarchical
Euclidean
Yes
Relative
75
0.216
Hierarchical
Euclidean
No
Relative
56
0.163
Hierarchical
Canberra
No
Absolute
73
0.156
Hierarchical
Manhattan
No
Absolute
74
0.152
Hierarchical
Canberra
Yes
Relative
65
0.148
Hierarchical
Euclidean
No
Absolute
78
0.104
Hierarchical
Manhattan
Yes
Absolute
52
0.102
Hierarchical
Jaccard
No
Binary
66
0.077
Hierarchical
Jaccard
Yes
Binary
67
0.058
Hierarchical
Euclidean
Yes
Absolute
59
0.027