

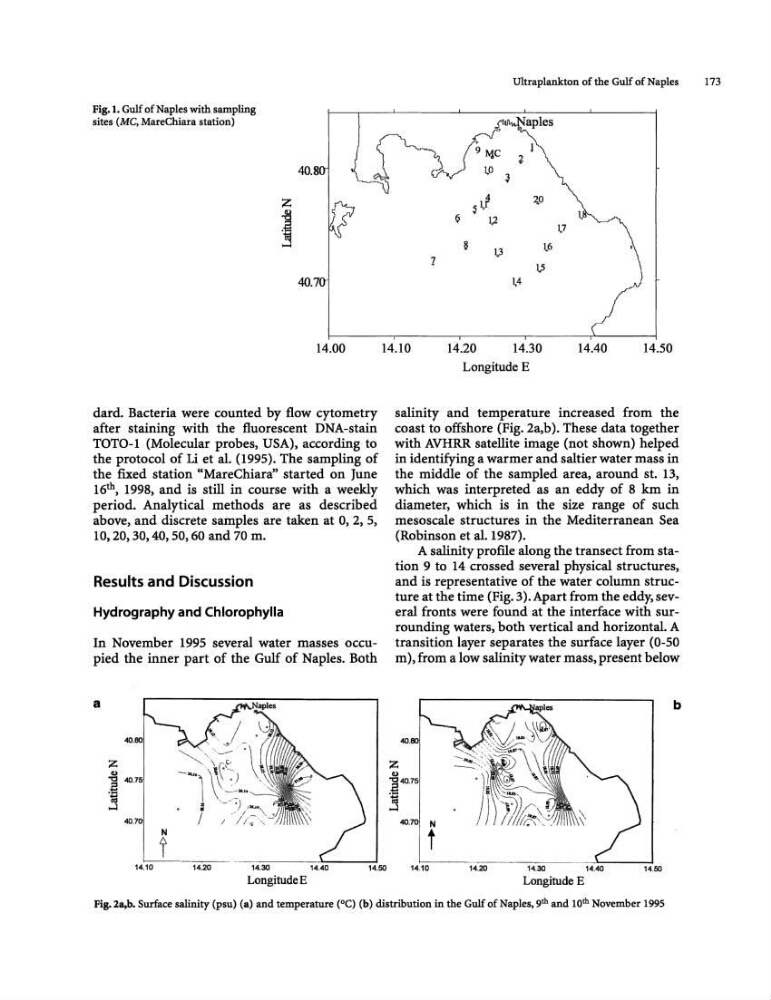
Fig-I. Gulf of Naples with sampling
sites (Me, MareChiara station)
Z
~
40.
40.
14.00
dard. Bacteria were counted by flow cytometry
after staining with the fluorescent DNA-stain
TOTO-1 (Molecular probes, USA), according to
the protocol of Li et al. (1995). The sampling of
the fIxed station "MareChiara" started on June
16 th , 1998, and is still in course with a weekly
period. Analytical methods are as described
above, and discrete samples are taken at 0, 2, 5,
10, 20, 30,40, 50, 60 and 70 m.
Results and Discussion
Hydrography and Chlorophylla
In November 1995 several water masses occupied the inner part of the Gulf of Naples. Both
a
N
T
14.10
14.20
Ultraplankton of the Gulf of Naples
173
~
~ ~~
4 0
{l
~2
1,
1,.7
~
~6
1
1.3
l.5
1.4
14.10
14.20
14.30
14.40
14.50
LongitudeE
salinity and temperature increased from the
coast to offshore (Fig. 2a,b). These data together
with AVHRR satellite image (not shown) helped
in identifying a warmer and saltier water mass in
the middle of the sampled area, around st. 13,
which was interpreted as an eddy of 8 km in
diameter, which is in the size range of such
mesoscale structures in the Mediterranean Sea
(Robinson et al. 1987).
A salinity proflle along the transect from station 9 to 14 crossed several physical structures,
and is representative of the water column structure at the time (Fig. 3). Apart from the eddy. several fronts were found at the interface with surrounding waters, both vertical and horizontal. A
transition layer separates the surface layer (0-50
m), from a low salinity water mass, present below
b
40.
40.
N
L!~~"~~ ___ ~'~---I
14.10
14.20
14.30
14.40
14.50
Longitude E
Fig-2a,b. Surface salinity (psu) (a) and temperature (DC) (b) distribution in the Gulf of Naples, 9 th and 10 th November 1995
sites (Me, MareChiara station)
Z
~
40.
40.
14.00
dard. Bacteria were counted by flow cytometry
after staining with the fluorescent DNA-stain
TOTO-1 (Molecular probes, USA), according to
the protocol of Li et al. (1995). The sampling of
the fIxed station "MareChiara" started on June
16 th , 1998, and is still in course with a weekly
period. Analytical methods are as described
above, and discrete samples are taken at 0, 2, 5,
10, 20, 30,40, 50, 60 and 70 m.
Results and Discussion
Hydrography and Chlorophylla
In November 1995 several water masses occupied the inner part of the Gulf of Naples. Both
a
N
T
14.10
14.20
Ultraplankton of the Gulf of Naples
173
~
~ ~~
4 0
{l
~2
1,
1,.7
~
~6
1
1.3
l.5
1.4
14.10
14.20
14.30
14.40
14.50
LongitudeE
salinity and temperature increased from the
coast to offshore (Fig. 2a,b). These data together
with AVHRR satellite image (not shown) helped
in identifying a warmer and saltier water mass in
the middle of the sampled area, around st. 13,
which was interpreted as an eddy of 8 km in
diameter, which is in the size range of such
mesoscale structures in the Mediterranean Sea
(Robinson et al. 1987).
A salinity proflle along the transect from station 9 to 14 crossed several physical structures,
and is representative of the water column structure at the time (Fig. 3). Apart from the eddy. several fronts were found at the interface with surrounding waters, both vertical and horizontal. A
transition layer separates the surface layer (0-50
m), from a low salinity water mass, present below
b
40.
40.
N
L!~~"~~ ___ ~'~---I
14.10
14.20
14.30
14.40
14.50
Longitude E
Fig-2a,b. Surface salinity (psu) (a) and temperature (DC) (b) distribution in the Gulf of Naples, 9 th and 10 th November 1995