

Biological Stress Indices in Tapes philippinarium from the Lagoon of Venice
93
Table 2. Transplantation experiment of T. philippinarum: physiological, biochemical and environmental parameters (mean ± 95% C.I.). Statistical comparison between transplanted and reference
clams and, in brackets, between transplanted clams (n.s. not significant)
Clearance rate (l h-1g- 1 )
0, uptake (pmol h-lg-l)
Scope for growth (} h-lg-l)
Latency (min)
POM (mg}"!)
Temperature (DC)
Salinity (%0)
,. P
a longer exposure period in order to significantly affect the responses of clams.
a
100
ao
60
%
40
20
0
2 3 4 5 6 7 8 9 10 11 12 13
days
C
100
o-o-Q"
ao
q
\
60
,
,
\
%
. \
•
40
tJ
\
,
Q.
20
•
\.
\
0-0..'0..
0
b.
2 3 4 5 6 7 8 9 10 11 12 13
days
n
16
16
16
10
4
Val Doga
Porto Marghera Palude della Rosa
2.198 ± 0.305 2.250 ± 0.462
2.240 ± 0.735
n.s.
n.s.(n.s.)
16.621 ± 2.245 15.911 ± 1.384
15.750 ± 3.896
n.s.
n.s.(n.s.)
1.520 ± 1.498
2.060 ± 1.901
2.091 ± 2.801
n.s.
n.s.(n.s.)
24 ± 4.801
17 ± 2.613
22 ± 2.613
**
n.s.(n.s.)
1.118 ± 0.048 0.789 ± 0.504
3.232 ± 0.302
18.0
17.5
18.0
30.04
29.29
26.65
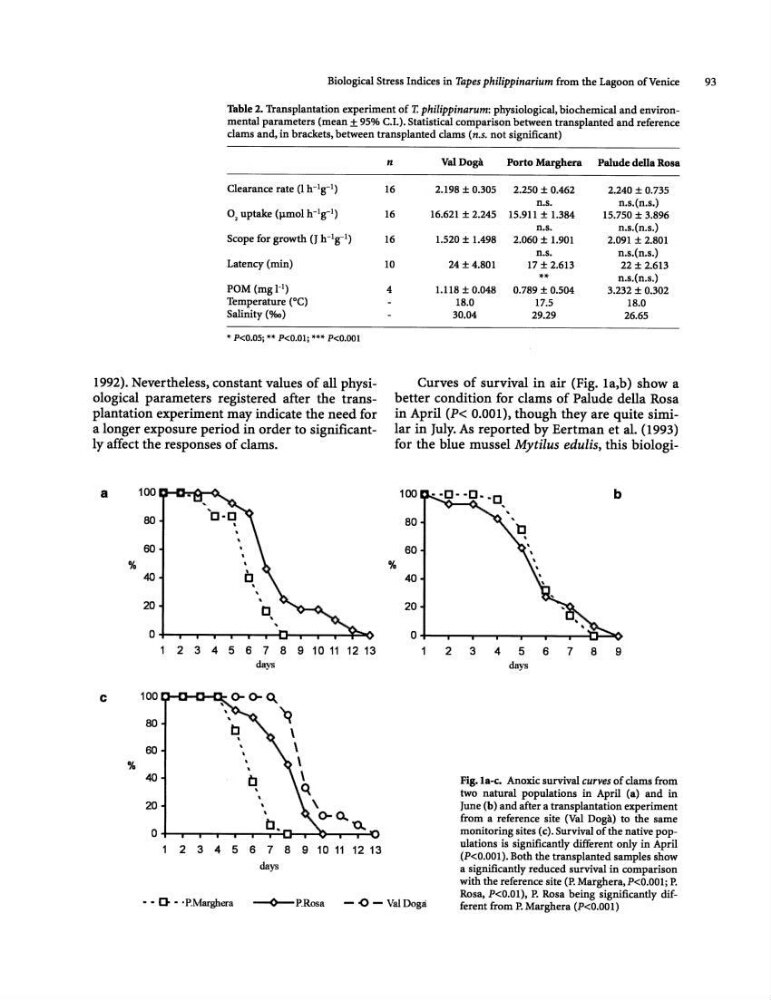
Curves of survival in air (Fig. 1a,b) show a
better condition for dams of Palude della Rosa
in April (P< 0.001), though they are quite similar in July. As reported by Eertman et al. (1993)
for the blue mussel Mytilus edulis, this biologi100
b
80
60
%
40
20
0
2 3 4 5 6 7 8 9
days
- - D •• P.Marghera
--0--P.Rosa
- <> - Val Doga
Fig. la-c. Anoxic survival curves of clams from
two natural populations in April (a) and in
June (b) and after a transplantation experiment
from a reference site (Val Doga) to the same
monitoring sites (c). Survival of the native populations is significantly different only in April
(P
with the reference site (P. Marghera, P
93
Table 2. Transplantation experiment of T. philippinarum: physiological, biochemical and environmental parameters (mean ± 95% C.I.). Statistical comparison between transplanted and reference
clams and, in brackets, between transplanted clams (n.s. not significant)
Clearance rate (l h-1g- 1 )
0, uptake (pmol h-lg-l)
Scope for growth (} h-lg-l)
Latency (min)
POM (mg}"!)
Temperature (DC)
Salinity (%0)
,. P
a longer exposure period in order to significantly affect the responses of clams.
a
100
ao
60
%
40
20
0
2 3 4 5 6 7 8 9 10 11 12 13
days
C
100
o-o-Q"
ao
q
\
60
,
,
\
%
. \
•
40
tJ
\
,
Q.
20
•
\.
\
0-0..'0..
0
b.
2 3 4 5 6 7 8 9 10 11 12 13
days
n
16
16
16
10
4
Val Doga
Porto Marghera Palude della Rosa
2.198 ± 0.305 2.250 ± 0.462
2.240 ± 0.735
n.s.
n.s.(n.s.)
16.621 ± 2.245 15.911 ± 1.384
15.750 ± 3.896
n.s.
n.s.(n.s.)
1.520 ± 1.498
2.060 ± 1.901
2.091 ± 2.801
n.s.
n.s.(n.s.)
24 ± 4.801
17 ± 2.613
22 ± 2.613
**
n.s.(n.s.)
1.118 ± 0.048 0.789 ± 0.504
3.232 ± 0.302
18.0
17.5
18.0
30.04
29.29
26.65
Curves of survival in air (Fig. 1a,b) show a
better condition for dams of Palude della Rosa
in April (P< 0.001), though they are quite similar in July. As reported by Eertman et al. (1993)
for the blue mussel Mytilus edulis, this biologi100
b
80
60
%
40
20
0
2 3 4 5 6 7 8 9
days
- - D •• P.Marghera
--0--P.Rosa
- <> - Val Doga
Fig. la-c. Anoxic survival curves of clams from
two natural populations in April (a) and in
June (b) and after a transplantation experiment
from a reference site (Val Doga) to the same
monitoring sites (c). Survival of the native populations is significantly different only in April
(P
with the reference site (P. Marghera, P