

66
4 Statistical Models and Techniques
2
~
~
ox
x~
' " +~~o ' <:J
0
0
+
N
+ 6';;6
~
Ox 4 +
0
Station
0 -1
'" 4
-2
+ 3
x 2
-3
o 1
-3
-2
-1
0
2
DIM(1)
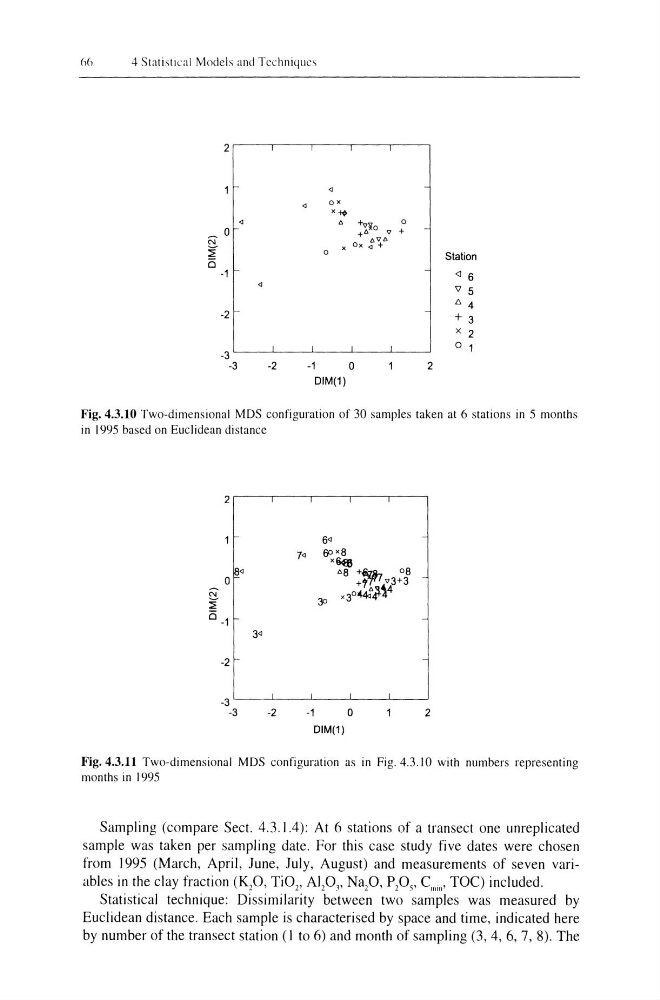
Fig. 4.3.10 Two-dimensional MDS configuration of 30 samples taken at 6 stations in 5 months
in 1995 based on Euclidean distance
2
6<
7~
6O x8
~~
x~
'" 8 +fJ:lfrr 08
0
+1'
"3+3
N
x3O>44o"'4l-~4
~
30
0_ 1
3<
-2
-3
-3
-2
-1
0
2
DIM(1)
Fig. 4.3.11 Two-dimensional MDS configuration as in Fig. 4.3.10 with numbers representing
months in 1995
Sampling (compare Sect. 4.3.1.4): At 6 stations of a transect one unreplicated
sample was taken per sampling date. For this case study five dates were chosen
from 1995 (March, April, June, July, August) and measurements of seven variables in the clay fraction (KP, Ti0 2 , AI 2 0]' Nap, pp" Cm;,,' TOC) included.
Statistical technique: Dissimilarity between two samples was measured by
Euclidean distance. Each sample is characterised by space and time, indicated here
by number of the transect station (I to 6) and month of sampling (3, 4, 6, 7, 8). The
4 Statistical Models and Techniques
2
~
~
ox
x~
' " +~~o ' <:J
0
0
+
N
+ 6';;6
~
Ox 4 +
0
Station
0 -1
'" 4
-2
+ 3
x 2
-3
o 1
-3
-2
-1
0
2
DIM(1)
Fig. 4.3.10 Two-dimensional MDS configuration of 30 samples taken at 6 stations in 5 months
in 1995 based on Euclidean distance
2
6<
7~
6O x8
~~
x~
'" 8 +fJ:lfrr 08
0
+1'
"3+3
N
x3O>44o"'4l-~4
~
30
0_ 1
3<
-2
-3
-3
-2
-1
0
2
DIM(1)
Fig. 4.3.11 Two-dimensional MDS configuration as in Fig. 4.3.10 with numbers representing
months in 1995
Sampling (compare Sect. 4.3.1.4): At 6 stations of a transect one unreplicated
sample was taken per sampling date. For this case study five dates were chosen
from 1995 (March, April, June, July, August) and measurements of seven variables in the clay fraction (KP, Ti0 2 , AI 2 0]' Nap, pp" Cm;,,' TOC) included.
Statistical technique: Dissimilarity between two samples was measured by
Euclidean distance. Each sample is characterised by space and time, indicated here
by number of the transect station (I to 6) and month of sampling (3, 4, 6, 7, 8). The