

5.6 Size Frequency. DistrIhutiun and Coluur Variatiun of Carcil/us II1IlCnllS
169
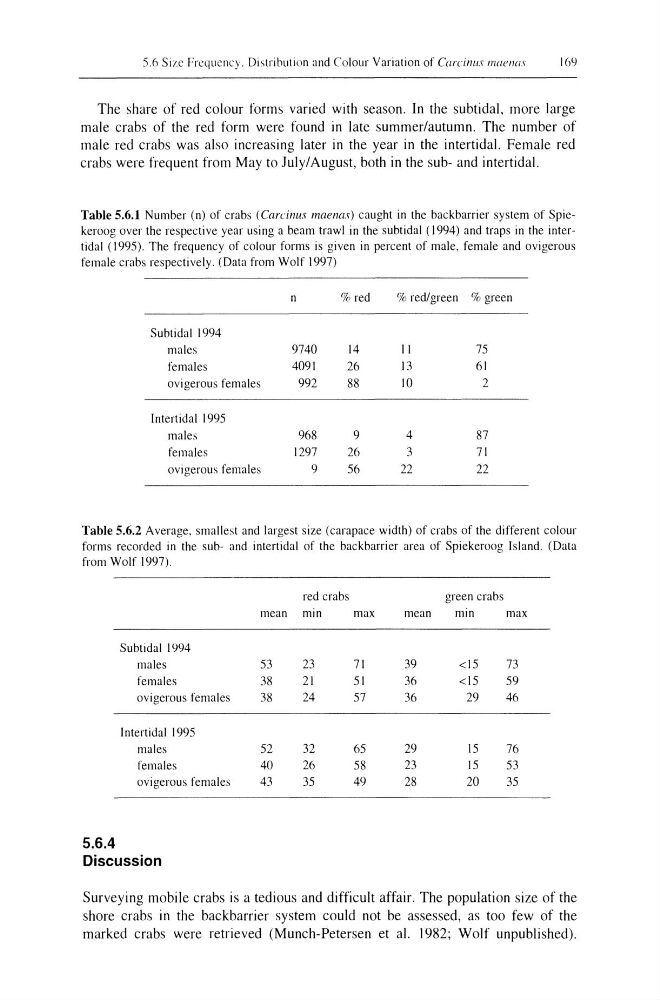
The share of red colour forms varied with season. In the subtidal, more large
male crabs of the red form were found in late summer/autumn. The number of
male red crabs was also increasing later in the year in the intertidal. Female red
crabs were frequent from May to July/August, both in the sub- and intertidal.
Table 5.6.1 Number (n) of crahs (Carcinus maenas) caught in the backbarrier system of Spiekeroog over the respective year using a beam trawl in the subtidal (1994) and traps in the intertidal (1995). The frequency of colour forms is given in percent of male, female and ovigerous
female crabs respectively. (Data from Wolf 1997)
n
% red
% red/green % green
Subtidal 1994
males
9740
14
I I
75
females
4091
26
13
61
ovigerous females
992
88
10
2
Intertidal 1995
males
968
9
4
87
females
1297
26
3
71
ovigerous females
9
56
22
22
Table 5.6.2 Average, smallest and largest size (carapace width) of crabs of the different colour
forms recorded in the sub- and intertidal of the backbarrier area of Spiekeroog Island. (Data
from Wolf 1997).
Subtidal 1994
males
females
ovigerous females
Intertidal 1995
males
females
ovigerous females
5.6.4
Discussion
red crahs
mean min
53
23
38
21
38
24
52
32
40
26
43
35
green crabs
max
mean
min
max
71
39
<15
73
51
36
<15
59
57
36
29
46
65
29
15
76
58
23
15
53
49
28
20
35
Surveying mobile crabs is a tedious and difficult affair. The population size of the
shore crabs in the backbarrier system could not be assessed, as too few of the
marked crabs were retrieved (Munch-Petersen et al. 1982; Wolf unpublished).
169
The share of red colour forms varied with season. In the subtidal, more large
male crabs of the red form were found in late summer/autumn. The number of
male red crabs was also increasing later in the year in the intertidal. Female red
crabs were frequent from May to July/August, both in the sub- and intertidal.
Table 5.6.1 Number (n) of crahs (Carcinus maenas) caught in the backbarrier system of Spiekeroog over the respective year using a beam trawl in the subtidal (1994) and traps in the intertidal (1995). The frequency of colour forms is given in percent of male, female and ovigerous
female crabs respectively. (Data from Wolf 1997)
n
% red
% red/green % green
Subtidal 1994
males
9740
14
I I
75
females
4091
26
13
61
ovigerous females
992
88
10
2
Intertidal 1995
males
968
9
4
87
females
1297
26
3
71
ovigerous females
9
56
22
22
Table 5.6.2 Average, smallest and largest size (carapace width) of crabs of the different colour
forms recorded in the sub- and intertidal of the backbarrier area of Spiekeroog Island. (Data
from Wolf 1997).
Subtidal 1994
males
females
ovigerous females
Intertidal 1995
males
females
ovigerous females
5.6.4
Discussion
red crahs
mean min
53
23
38
21
38
24
52
32
40
26
43
35
green crabs
max
mean
min
max
71
39
<15
73
51
36
<15
59
57
36
29
46
65
29
15
76
58
23
15
53
49
28
20
35
Surveying mobile crabs is a tedious and difficult affair. The population size of the
shore crabs in the backbarrier system could not be assessed, as too few of the
marked crabs were retrieved (Munch-Petersen et al. 1982; Wolf unpublished).