

5.2 Biogeochemical Processes and Interactions
105
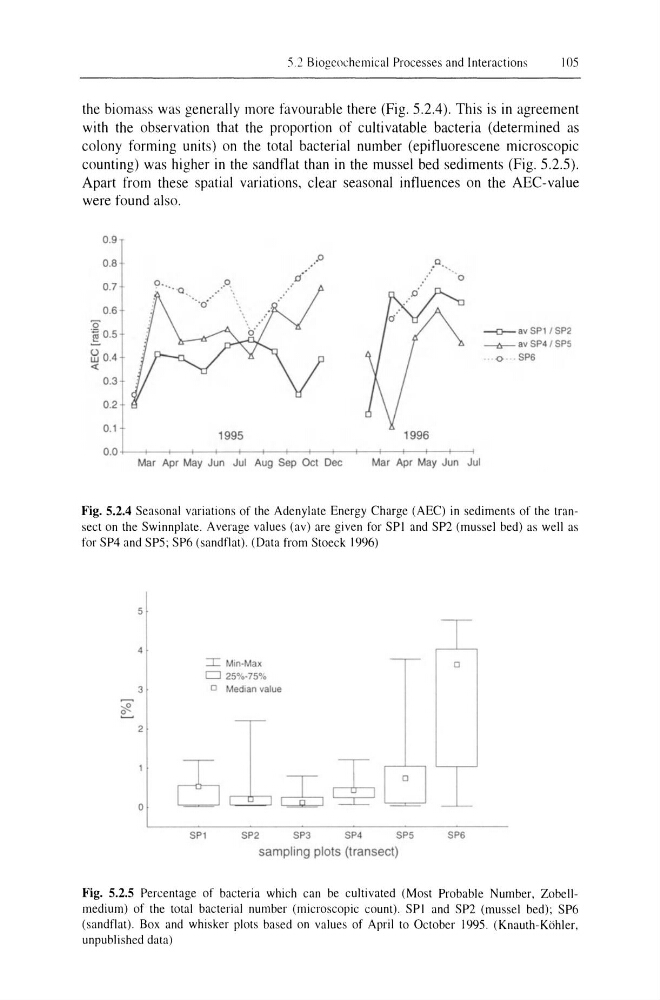
the biomass was generally more favourable there (Fig. 5.2.4). This is in agreement
with the observation that the proportion of cultivatable bacteria (determined as
colony forming units) on the total bacterial number (epit1uorescene microscopic
counting) was higher in the sandt1at than in the mussel bed sediments (Fig. 5.2.5).
Apart from these spatial variations, clear seasonal int1uences on the AEC-value
were found also.
0.9
0.8
0.7
0.6
"0
! 0.5
~ 0.4
<{
0.3
0.2
0.1
1995
.• 0
.'
0 '
1996
O . O ~-+--~~--~~--~--~~--~-r--+--+--+--+~
Mar Apr May Jun Jul Aug Sep Ocl Dec
Mar Apr May Jun Jul
--0-- av SP 1 / SP2
_ _ avSP4 / SP5
· 0 ·· SP6
Fig. 5.2.4 Seasonal variations of the Adenylate Energy Charge (AEC) in sediments of the transect on the Swinnplate. Average values (av) are given for SPI and SP2 (mussel bed) as well as
for SP4 and SP5; SP6 (sandtlat). (Data from Stoeck 1996)
5
4
I
Min·Max
0
CJ 25%-75%
3
o Median value
~ ~
2
0
2; c±,~
SPI
SP2
SP3
SP4
SP5
SP6
sampling plots (transect)
Fig. 5.2.5 Percentage of bacteria which can be cultivated (Most Probable Number, Zobellmedium) of the total bacterial number (microscopic count). SPI and SP2 (mussel bed); SP6
(sandtlat). Box and whisker plots based on values of April to October 1995. (Knauth- Kohler,
unpublished data)
105
the biomass was generally more favourable there (Fig. 5.2.4). This is in agreement
with the observation that the proportion of cultivatable bacteria (determined as
colony forming units) on the total bacterial number (epit1uorescene microscopic
counting) was higher in the sandt1at than in the mussel bed sediments (Fig. 5.2.5).
Apart from these spatial variations, clear seasonal int1uences on the AEC-value
were found also.
0.9
0.8
0.7
0.6
"0
! 0.5
~ 0.4
<{
0.3
0.2
0.1
1995
.• 0
.'
0 '
1996
O . O ~-+--~~--~~--~--~~--~-r--+--+--+--+~
Mar Apr May Jun Jul Aug Sep Ocl Dec
Mar Apr May Jun Jul
--0-- av SP 1 / SP2
_ _ avSP4 / SP5
· 0 ·· SP6
Fig. 5.2.4 Seasonal variations of the Adenylate Energy Charge (AEC) in sediments of the transect on the Swinnplate. Average values (av) are given for SPI and SP2 (mussel bed) as well as
for SP4 and SP5; SP6 (sandtlat). (Data from Stoeck 1996)
5
4
I
Min·Max
0
CJ 25%-75%
3
o Median value
~ ~
2
0
2; c±,~
SPI
SP2
SP3
SP4
SP5
SP6
sampling plots (transect)
Fig. 5.2.5 Percentage of bacteria which can be cultivated (Most Probable Number, Zobellmedium) of the total bacterial number (microscopic count). SPI and SP2 (mussel bed); SP6
(sandtlat). Box and whisker plots based on values of April to October 1995. (Knauth- Kohler,
unpublished data)