

314
Second stage: separation and discrimination of
larvae, juveniles, and seaweeds by the frequency difference method
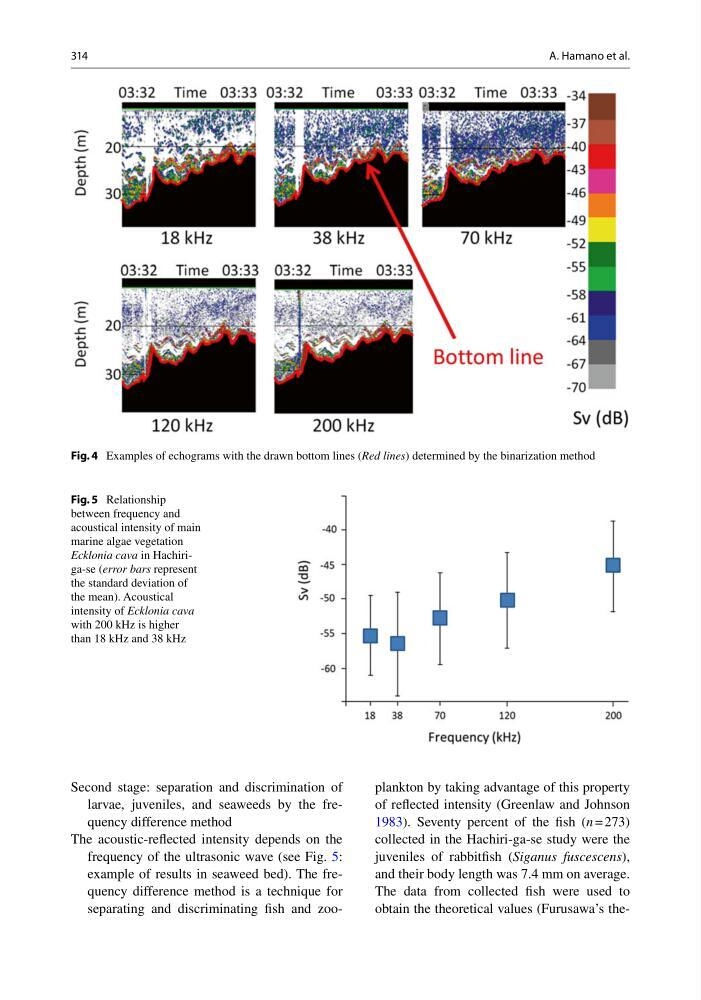
The acoustic-refl ected intensity depends on the
frequency of the ultrasonic wave (see Fig. 5 :
example of results in seaweed bed). The frequency difference method is a technique for
separating and discriminating fi sh and zooplankton by taking advantage of this property
of refl ected intensity (Greenlaw and Johnson
1983 ). Seventy percent of the fi sh ( n = 273)
collected in the Hachiri-ga-se study were the
juveniles of rabbitfi sh ( Siganus fuscescens ),
and their body length was 7.4 mm on average.
The data from collected fi sh were used to
obtain the theoretical values (Furusawa’s theFig. 4 Examples of echograms with the drawn bottom lines ( Red lines ) determined by the binarization method
Fig. 5 Relationship
between frequency and
acoustical intensity of main
marine algae vegetation
Ecklonia cava in Hachiriga- se ( error bars represent
the standard deviation of
the mean). Acoustical
intensity of Ecklonia cava
with 200 kHz is higher
than 18 kHz and 38 kHz
A. Hamano et al.
Second stage: separation and discrimination of
larvae, juveniles, and seaweeds by the frequency difference method
The acoustic-refl ected intensity depends on the
frequency of the ultrasonic wave (see Fig. 5 :
example of results in seaweed bed). The frequency difference method is a technique for
separating and discriminating fi sh and zooplankton by taking advantage of this property
of refl ected intensity (Greenlaw and Johnson
1983 ). Seventy percent of the fi sh ( n = 273)
collected in the Hachiri-ga-se study were the
juveniles of rabbitfi sh ( Siganus fuscescens ),
and their body length was 7.4 mm on average.
The data from collected fi sh were used to
obtain the theoretical values (Furusawa’s theFig. 4 Examples of echograms with the drawn bottom lines ( Red lines ) determined by the binarization method
Fig. 5 Relationship
between frequency and
acoustical intensity of main
marine algae vegetation
Ecklonia cava in Hachiriga- se ( error bars represent
the standard deviation of
the mean). Acoustical
intensity of Ecklonia cava
with 200 kHz is higher
than 18 kHz and 38 kHz
A. Hamano et al.