

218
In this example, we evaluated the reliability of
commercial fi shing data for deriving occupancy
indicators that could serve as proxies for stock
abundance using a simulation approach (Trenkel
et al. 2013 ). For this, four questions were investigated: (1) Occupancy changes with stock biomass,
but is this change strong enough to make occupancy a sensitive indicator of population biomass?
(2) Fishing boats follow fi sh, but when does such
activity alter the positive macroecological relationship between occupancy and abundance? (3)
When does the activity of pursuing fi sh adversely
affect occupancy estimates derived from catch and
effort data? (4) How does uncertainty in fi shing
effort data affect occupancy estimates?
The spatial simulations mimicked the dynamics of four deep-water fi sh species. The results
showed that biomass-occupancy relationships
can be weak and fi shers following fi sh can modify the spatial distribution of target species, even
reversing the sign of the biomass-occupancy relationship in certain cases. They can also affect the
reliability of occupancy indicators, which can
also be impaired by error in effort data. Using
commercial catch and effort data and abundance
indices for deep-sea fi sh populations to the west
of the British Isles, it was found that only for
roundnose grenadier might occupancy provide
insights into biomass changes. Thus, care should
be taken when using occupancy for evaluating
range changes in cases where fi shing might have
modifi ed spatial distributions, when uncertain
commercial data are used or when the abundanceoccupancy relationship is too fl at, i.e. when occupancy changes little with abundance.
5
Investigating the Link
Between Fishing Pressure
and Fishing Impact
Indicators
There is increasing awareness that for developing
an ecosystem approach to fi sheries management
it might be required to broaden our perspective
on fi sheries selectivity from the gear and haul
level to the fi shery and exploited community
scale (Garcia et al. 2012 ). Indeed, recent modelling results suggest that selectively targeting
restricted ranges of species or sizes may be more
harmful to marine communities than a more
“balanced” exploitation apportioning extraction
across the food web. This example sought empirical evidence supporting these modelling results
by means of a comparative study across communities exploited in different ways.
A comparative analysis of fi shing pressure
versus fi shing impact metrics across a range of
temperate, exploited shelf communities was
undertaken to investigate empirically the link
between fi sheries selectivity and the biodiversity
in exploited communities (Rochet et al. 2013a , b ).
In this analysis, individuals were “ecological
units” – distinct communities with defi ned fi shing patterns. The temporal units were periods of
time with a consistent fi shing pressure, with a
time lag between fi shing pressure and impact.
The question studied was whether there was evidence of a link between metrics of fi shing pressure, including selectivity metrics, and metrics of
fi shing impacts. Time series of fi shing pressure
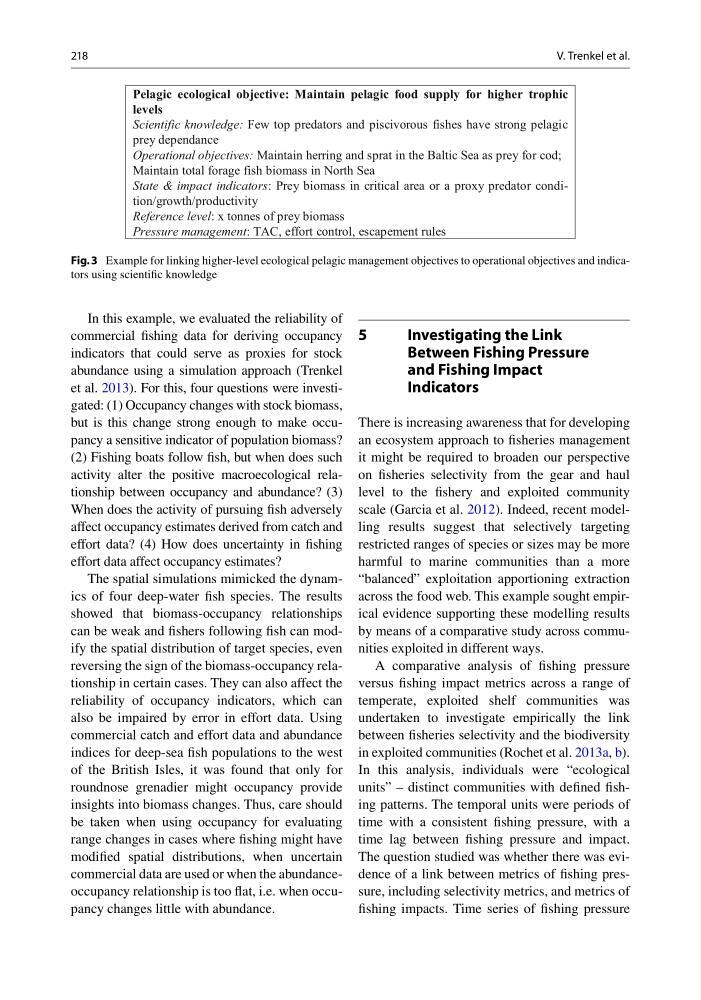
Pelagic ecological objective: Maintain pelagic food supply for higher trophic
levels
Scientific knowledge: Few top predators and piscivorous fishes have strong pelagic
prey dependance
Operational objectives: Maintain herring and sprat in the Baltic Sea as prey for cod;
Maintain total forage fish biomass in North Sea
State & impact indicators: Prey biomass in critical area or a proxy predator condition/growth/productivity
Reference level: x tonnes of prey biomass
Pressure management: TAC, effort control, escapement rules
Fig. 3 Example for linking higher-level ecological pelagic management objectives to operational objectives and indicators using scientifi c knowledge
V. Trenkel et al.
In this example, we evaluated the reliability of
commercial fi shing data for deriving occupancy
indicators that could serve as proxies for stock
abundance using a simulation approach (Trenkel
et al. 2013 ). For this, four questions were investigated: (1) Occupancy changes with stock biomass,
but is this change strong enough to make occupancy a sensitive indicator of population biomass?
(2) Fishing boats follow fi sh, but when does such
activity alter the positive macroecological relationship between occupancy and abundance? (3)
When does the activity of pursuing fi sh adversely
affect occupancy estimates derived from catch and
effort data? (4) How does uncertainty in fi shing
effort data affect occupancy estimates?
The spatial simulations mimicked the dynamics of four deep-water fi sh species. The results
showed that biomass-occupancy relationships
can be weak and fi shers following fi sh can modify the spatial distribution of target species, even
reversing the sign of the biomass-occupancy relationship in certain cases. They can also affect the
reliability of occupancy indicators, which can
also be impaired by error in effort data. Using
commercial catch and effort data and abundance
indices for deep-sea fi sh populations to the west
of the British Isles, it was found that only for
roundnose grenadier might occupancy provide
insights into biomass changes. Thus, care should
be taken when using occupancy for evaluating
range changes in cases where fi shing might have
modifi ed spatial distributions, when uncertain
commercial data are used or when the abundanceoccupancy relationship is too fl at, i.e. when occupancy changes little with abundance.
5
Investigating the Link
Between Fishing Pressure
and Fishing Impact
Indicators
There is increasing awareness that for developing
an ecosystem approach to fi sheries management
it might be required to broaden our perspective
on fi sheries selectivity from the gear and haul
level to the fi shery and exploited community
scale (Garcia et al. 2012 ). Indeed, recent modelling results suggest that selectively targeting
restricted ranges of species or sizes may be more
harmful to marine communities than a more
“balanced” exploitation apportioning extraction
across the food web. This example sought empirical evidence supporting these modelling results
by means of a comparative study across communities exploited in different ways.
A comparative analysis of fi shing pressure
versus fi shing impact metrics across a range of
temperate, exploited shelf communities was
undertaken to investigate empirically the link
between fi sheries selectivity and the biodiversity
in exploited communities (Rochet et al. 2013a , b ).
In this analysis, individuals were “ecological
units” – distinct communities with defi ned fi shing patterns. The temporal units were periods of
time with a consistent fi shing pressure, with a
time lag between fi shing pressure and impact.
The question studied was whether there was evidence of a link between metrics of fi shing pressure, including selectivity metrics, and metrics of
fi shing impacts. Time series of fi shing pressure
Pelagic ecological objective: Maintain pelagic food supply for higher trophic
levels
Scientific knowledge: Few top predators and piscivorous fishes have strong pelagic
prey dependance
Operational objectives: Maintain herring and sprat in the Baltic Sea as prey for cod;
Maintain total forage fish biomass in North Sea
State & impact indicators: Prey biomass in critical area or a proxy predator condition/growth/productivity
Reference level: x tonnes of prey biomass
Pressure management: TAC, effort control, escapement rules
Fig. 3 Example for linking higher-level ecological pelagic management objectives to operational objectives and indicators using scientifi c knowledge
V. Trenkel et al.