

217
(i.e. FG12, FG5, FG1, FG10) showed a signifi -
cant increase in time, with the cephalopods
increasing by over 120 %. Simultaneously, benthic and particularly demersal FG decreased in
the Gulf of Lions and Aegean Sea but showed
opposite trends in the Ionian Sea.
It is generally accepted that moderate enrichment leads to an increase in ecosystem production (Caddy et al. 1995 ), while over-enrichment
may reduce benthic and demersal production by
oxygen depletion and other undesirable effects
(Seitz et al. 2009 ). The three study areas show
differences in production (Coll et al. 2010 ) and to
a lesser extent fi shing efforts (Coll et al. 2012 )
which might explain some of the observed
patterns.
3
Selecting Pelagic Ecosystem
Indicators
Pelagic ecosystems set distinct requirements for
indicators, since the constituent species can exhibit
substantial, environmentally infl uenced, fl uctuations in abundance and wide-ranging mobility.
Small pelagic fi sh communities consist of few
species. In contrast to many demersal mixedspecies fi sheries, pelagic fi shing generally targets
single species, so direct fi shing impacts affect single stocks, though indirect effects may cause food
web perturbations ( Rochet et al. 2013a , b ).
In this example, we identifi ed high level
ecological, economic and social objectives for
European exploited pelagic ecosystems in a
stakeholder consultation process and proposed
operational management objectives and suitable
indicators based on the literature on pressures and
impacts (Trenkel et al. in press ) (see Fig. 3 for an
example). We found that given the strong but species-specifi c links of pelagic species with the environment and the large geographic scale of their life
cycles, pelagic indicators are needed at the level of
stocks, independent of area, while community indicators may be set for certain (sub-)areas.
4
Evaluating Spatial
Population Indicators
The distribution area of many populations is positively related to abundance such that, at large
population size, more habitat space is occupied
and abundance-occupancy relationships form
well-known macroecological patterns (e.g. Frisk
et al. 2011 ). Various theories exit to explain
abundance- occupancy relationships including
density-dependent habitat selection (ideal free
distribution theory), local vital rates (birth and
death) and range position (Gaston et al. 2000 ). In
the absence of abundance information, indicators
of spatial distribution have been proposed as a
direct measure of population status (EC 2010 ).
PAGEBOG
PAGEERY
SPONDCAN
PAGEACA
DIPLANN
DIPLVUL
ARGESPP
ARGESPY
PHYIBLE
SCOMPNE
SCOMSCO
SPICSMA
SARDPIL
SPRASPR
MERLMER
TRISCAP
GADIARG
MICMPOU
SPICFLE
TRACMED
TRACTRA
BOOPBOO
ENGRENC
RAJAAST
RAJACLA
BOTHPOD
TORPMAR
BLENOCE
SCORNOT
HELIDAC
SCORSCR
SCORELO
SCORPOR
CALMMAC
LOPHBUD
LOPHPIS
ZEUSFAB
CAPOAPE
MACOSCO
TRAHDRA
TRAHRAD
SYMPNIG
URANSCA
EUTRGUR
GAIDSPP
CHELOBS
MERNMER
MULLBAR
MULLSUR
SERACAB
SERAHEP
GALUMEL
SCYOCAN
LEPMBOS
LEPMWHS
ARNOIMP
ARNORUP
CITHMAC
SOLEVUL
ARNOTHO
MONOHIS
ARNOLAT
MICUVAR
LEPTDIE
TRIGLYR
CHELLAS
TRIPLAS
PERICAT
CHELLUC
ASPICUC
LEPTCAV
LEPICAU
ECHEMYR
CEPOMAC
CONGCON
0
1
2
3
Height
FG10
FG1
FG5
FG6
FG4
FG7
FG9
FG2
FG3
FG8
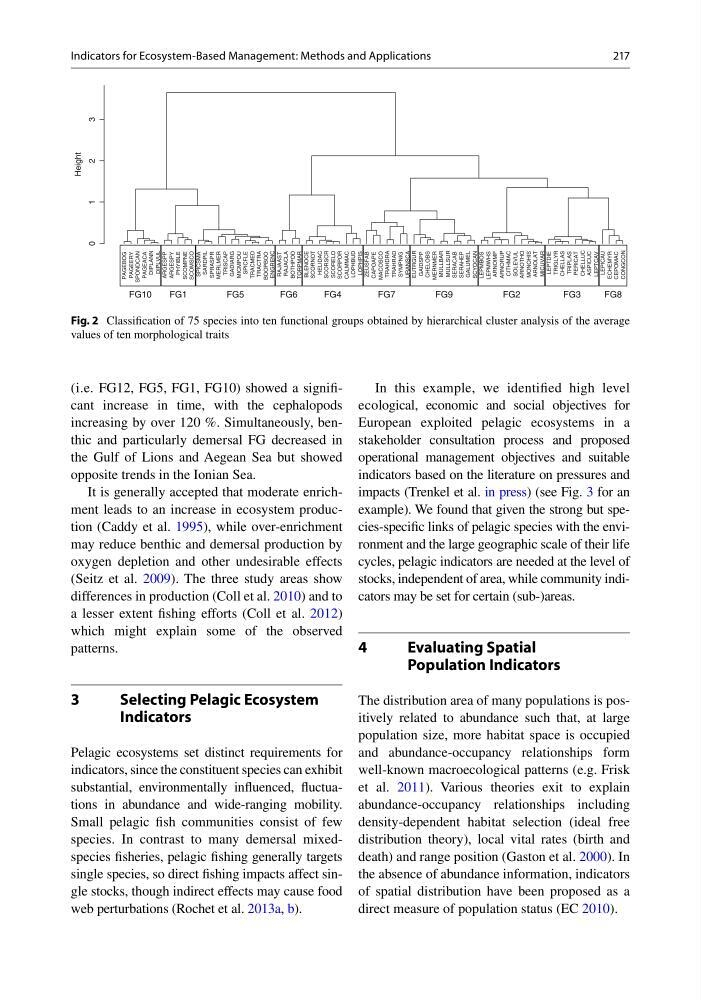
Fig. 2 Classifi cation of 75 species into ten functional groups obtained by hierarchical cluster analysis of the average
values of ten morphological traits
Indicators for Ecosystem-Based Management: Methods and Applications
(i.e. FG12, FG5, FG1, FG10) showed a signifi -
cant increase in time, with the cephalopods
increasing by over 120 %. Simultaneously, benthic and particularly demersal FG decreased in
the Gulf of Lions and Aegean Sea but showed
opposite trends in the Ionian Sea.
It is generally accepted that moderate enrichment leads to an increase in ecosystem production (Caddy et al. 1995 ), while over-enrichment
may reduce benthic and demersal production by
oxygen depletion and other undesirable effects
(Seitz et al. 2009 ). The three study areas show
differences in production (Coll et al. 2010 ) and to
a lesser extent fi shing efforts (Coll et al. 2012 )
which might explain some of the observed
patterns.
3
Selecting Pelagic Ecosystem
Indicators
Pelagic ecosystems set distinct requirements for
indicators, since the constituent species can exhibit
substantial, environmentally infl uenced, fl uctuations in abundance and wide-ranging mobility.
Small pelagic fi sh communities consist of few
species. In contrast to many demersal mixedspecies fi sheries, pelagic fi shing generally targets
single species, so direct fi shing impacts affect single stocks, though indirect effects may cause food
web perturbations ( Rochet et al. 2013a , b ).
In this example, we identifi ed high level
ecological, economic and social objectives for
European exploited pelagic ecosystems in a
stakeholder consultation process and proposed
operational management objectives and suitable
indicators based on the literature on pressures and
impacts (Trenkel et al. in press ) (see Fig. 3 for an
example). We found that given the strong but species-specifi c links of pelagic species with the environment and the large geographic scale of their life
cycles, pelagic indicators are needed at the level of
stocks, independent of area, while community indicators may be set for certain (sub-)areas.
4
Evaluating Spatial
Population Indicators
The distribution area of many populations is positively related to abundance such that, at large
population size, more habitat space is occupied
and abundance-occupancy relationships form
well-known macroecological patterns (e.g. Frisk
et al. 2011 ). Various theories exit to explain
abundance- occupancy relationships including
density-dependent habitat selection (ideal free
distribution theory), local vital rates (birth and
death) and range position (Gaston et al. 2000 ). In
the absence of abundance information, indicators
of spatial distribution have been proposed as a
direct measure of population status (EC 2010 ).
PAGEBOG
PAGEERY
SPONDCAN
PAGEACA
DIPLANN
DIPLVUL
ARGESPP
ARGESPY
PHYIBLE
SCOMPNE
SCOMSCO
SPICSMA
SARDPIL
SPRASPR
MERLMER
TRISCAP
GADIARG
MICMPOU
SPICFLE
TRACMED
TRACTRA
BOOPBOO
ENGRENC
RAJAAST
RAJACLA
BOTHPOD
TORPMAR
BLENOCE
SCORNOT
HELIDAC
SCORSCR
SCORELO
SCORPOR
CALMMAC
LOPHBUD
LOPHPIS
ZEUSFAB
CAPOAPE
MACOSCO
TRAHDRA
TRAHRAD
SYMPNIG
URANSCA
EUTRGUR
GAIDSPP
CHELOBS
MERNMER
MULLBAR
MULLSUR
SERACAB
SERAHEP
GALUMEL
SCYOCAN
LEPMBOS
LEPMWHS
ARNOIMP
ARNORUP
CITHMAC
SOLEVUL
ARNOTHO
MONOHIS
ARNOLAT
MICUVAR
LEPTDIE
TRIGLYR
CHELLAS
TRIPLAS
PERICAT
CHELLUC
ASPICUC
LEPTCAV
LEPICAU
ECHEMYR
CEPOMAC
CONGCON
0
1
2
3
Height
FG10
FG1
FG5
FG6
FG4
FG7
FG9
FG2
FG3
FG8
Fig. 2 Classifi cation of 75 species into ten functional groups obtained by hierarchical cluster analysis of the average
values of ten morphological traits
Indicators for Ecosystem-Based Management: Methods and Applications