

150
(ANOVA). Multiple comparisons between
groups were made by the Tukey-Kramer method.
3
Results
3.1
Plasma Cortisol and Glucose
Levels
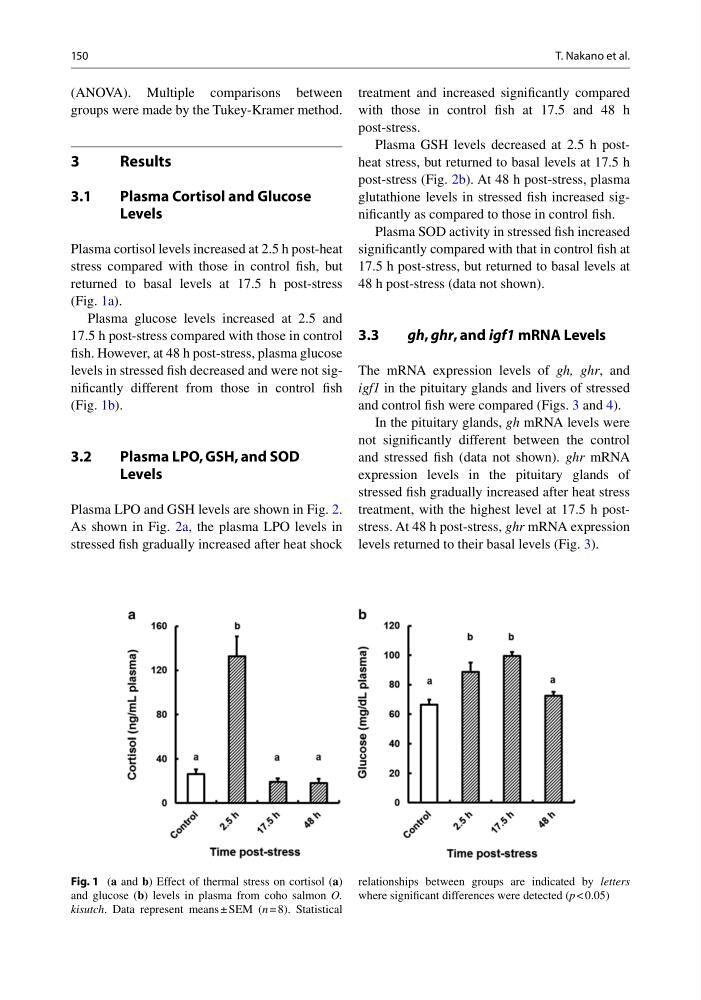
Plasma cortisol levels increased at 2.5 h post-heat
stress compared with those in control fi sh, but
returned to basal levels at 17.5 h post-stress
(Fig. 1a ).
Plasma glucose levels increased at 2.5 and
17.5 h post-stress compared with those in control
fi sh. However, at 48 h post-stress, plasma glucose
levels in stressed fi sh decreased and were not signifi cantly different from those in control fi sh
(Fig. 1b ).
3.2
Plasma LPO, GSH, and SOD
Levels
Plasma LPO and GSH levels are shown in Fig. 2 .
As shown in Fig. 2a , the plasma LPO levels in
stressed fi sh gradually increased after heat shock
treatment and increased signifi cantly compared
with those in control fi sh at 17.5 and 48 h
post-stress.
Plasma GSH levels decreased at 2.5 h postheat stress, but returned to basal levels at 17.5 h
post-stress (Fig. 2b ). At 48 h post-stress, plasma
glutathione levels in stressed fi sh increased signifi cantly as compared to those in control fi sh.
Plasma SOD activity in stressed fi sh increased
signifi cantly compared with that in control fi sh at
17.5 h post-stress, but returned to basal levels at
48 h post-stress (data not shown).
3.3
gh, ghr, and igf1 mRNA Levels
The mRNA expression levels of gh, ghr, and
igf1 in the pituitary glands and livers of stressed
and control fi sh were compared (Figs. 3 and 4 ).
In the pituitary glands, gh mRNA levels were
not signifi cantly different between the control
and stressed fi sh (data not shown). ghr mRNA
expression levels in the pituitary glands of
stressed fi sh gradually increased after heat stress
treatment, with the highest level at 17.5 h poststress. At 48 h post-stress, ghr mRNA expression
levels returned to their basal levels (Fig. 3 ).
Fig. 1 ( a and b ) Effect of thermal stress on cortisol ( a )
and glucose ( b ) levels in plasma from coho salmon O.
kisutch . Data represent means ± SEM ( n = 8). Statistical
relationships between groups are indicated by letters
where signifi cant differences were detected ( p < 0.05)
T. Nakano et al.
(ANOVA). Multiple comparisons between
groups were made by the Tukey-Kramer method.
3
Results
3.1
Plasma Cortisol and Glucose
Levels
Plasma cortisol levels increased at 2.5 h post-heat
stress compared with those in control fi sh, but
returned to basal levels at 17.5 h post-stress
(Fig. 1a ).
Plasma glucose levels increased at 2.5 and
17.5 h post-stress compared with those in control
fi sh. However, at 48 h post-stress, plasma glucose
levels in stressed fi sh decreased and were not signifi cantly different from those in control fi sh
(Fig. 1b ).
3.2
Plasma LPO, GSH, and SOD
Levels
Plasma LPO and GSH levels are shown in Fig. 2 .
As shown in Fig. 2a , the plasma LPO levels in
stressed fi sh gradually increased after heat shock
treatment and increased signifi cantly compared
with those in control fi sh at 17.5 and 48 h
post-stress.
Plasma GSH levels decreased at 2.5 h postheat stress, but returned to basal levels at 17.5 h
post-stress (Fig. 2b ). At 48 h post-stress, plasma
glutathione levels in stressed fi sh increased signifi cantly as compared to those in control fi sh.
Plasma SOD activity in stressed fi sh increased
signifi cantly compared with that in control fi sh at
17.5 h post-stress, but returned to basal levels at
48 h post-stress (data not shown).
3.3
gh, ghr, and igf1 mRNA Levels
The mRNA expression levels of gh, ghr, and
igf1 in the pituitary glands and livers of stressed
and control fi sh were compared (Figs. 3 and 4 ).
In the pituitary glands, gh mRNA levels were
not signifi cantly different between the control
and stressed fi sh (data not shown). ghr mRNA
expression levels in the pituitary glands of
stressed fi sh gradually increased after heat stress
treatment, with the highest level at 17.5 h poststress. At 48 h post-stress, ghr mRNA expression
levels returned to their basal levels (Fig. 3 ).
Fig. 1 ( a and b ) Effect of thermal stress on cortisol ( a )
and glucose ( b ) levels in plasma from coho salmon O.
kisutch . Data represent means ± SEM ( n = 8). Statistical
relationships between groups are indicated by letters
where signifi cant differences were detected ( p < 0.05)
T. Nakano et al.