

133
where the fractal dimension D m is estimated
from the slope of the linear trend of the log-log
plot of m(δ) vs. δ.
1
The results of studies based on a geometric
assessment
of
zooplankton
behavioural
complexity under various conditions of water
contaminations—i.e. short-term exposure to copper, organophosphorus and carbamate (Shimizu
et al. 2002), the water-soluble fraction of diesel
oil (Seuront 2010a, b, 2012), nonylphenol, cadmium and a mixture of polycyclic aromatic
hydrocarbons (Michalec et al. 2013a, b)—lead a
variety of a priori conflicting conclusions, including no change (Michalec et al. 2013a, b), a
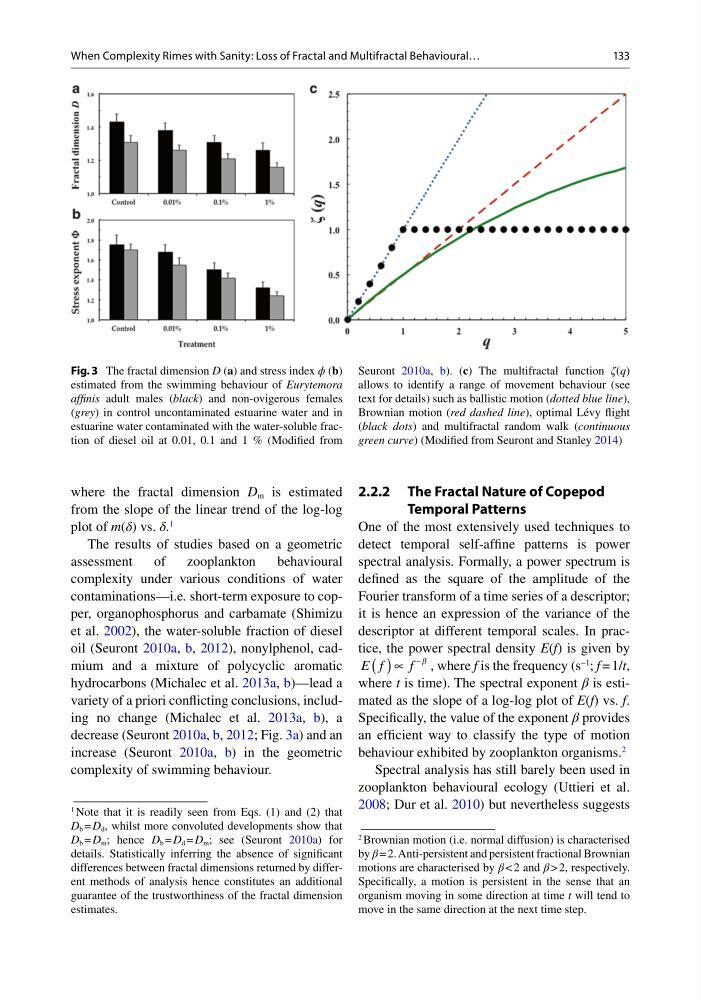
decrease (Seuront 2010a, b, 2012; Fig. 3a) and an
increase (Seuront 2010a, b) in the geometric
complexity of swimming behaviour.
1 Note that it is readily seen from Eqs. (1) and (2) that
D b = D d , whilst more convoluted developments show that
D b = D m ; hence D b = D d = D m ; see (Seuront 2010a) for
details. Statistically inferring the absence of significant
differences between fractal dimensions returned by different methods of analysis hence constitutes an additional
guarantee of the trustworthiness of the fractal dimension
estimates.
2.2.2 The Fractal Nature of Copepod
Temporal Patterns
One of the most extensively used techniques to
detect temporal self-affine patterns is power
spectral analysis. Formally, a power spectrum is
defined as the square of the amplitude of the
Fourier transform of a time series of a descriptor;
it is hence an expression of the variance of the
descriptor at different temporal scales. In practice, the power spectral density E(f) is given by
E f
f
( )∝
−β , where f is the frequency (s
−1
; f = 1/t,
where t is time). The spectral exponent β is estimated as the slope of a log-log plot of E(f) vs. f.
Specifically, the value of the exponent β provides
an efficient way to classify the type of motion
behaviour exhibited by zooplankton organisms.
2
Spectral analysis has still barely been used in
zooplankton behavioural ecology (Uttieri et al.
2008; Dur et al. 2010) but nevertheless suggests
2 Brownian motion (i.e. normal diffusion) is characterised
by β = 2. Anti-persistent and persistent fractional Brownian
motions are characterised by β < 2 and β > 2, respectively.
Specifically, a motion is persistent in the sense that an
organism moving in some direction at time t will tend to
move in the same direction at the next time step.
Fig. 3 The fractal dimension D (a) and stress index ϕ (b)
estimated from the swimming behaviour of Eurytemora
affinis adult males (black) and non-ovigerous females
(grey) in control uncontaminated estuarine water and in
estuarine water contaminated with the water-soluble fraction of diesel oil at 0.01, 0.1 and 1 % (Modified from
Seuront 2010a, b). (c) The multifractal function ζ(q)
allows to identify a range of movement behaviour (see
text for details) such as ballistic motion (dotted blue line),
Brownian motion (red dashed line), optimal Lévy flight
(black dots) and multifractal random walk (continuous
green curve) (Modified from Seuront and Stanley 2014)
When Complexity Rimes with Sanity: Loss of Fractal and Multifractal Behavioural…
where the fractal dimension D m is estimated
from the slope of the linear trend of the log-log
plot of m(δ) vs. δ.
1
The results of studies based on a geometric
assessment
of
zooplankton
behavioural
complexity under various conditions of water
contaminations—i.e. short-term exposure to copper, organophosphorus and carbamate (Shimizu
et al. 2002), the water-soluble fraction of diesel
oil (Seuront 2010a, b, 2012), nonylphenol, cadmium and a mixture of polycyclic aromatic
hydrocarbons (Michalec et al. 2013a, b)—lead a
variety of a priori conflicting conclusions, including no change (Michalec et al. 2013a, b), a
decrease (Seuront 2010a, b, 2012; Fig. 3a) and an
increase (Seuront 2010a, b) in the geometric
complexity of swimming behaviour.
1 Note that it is readily seen from Eqs. (1) and (2) that
D b = D d , whilst more convoluted developments show that
D b = D m ; hence D b = D d = D m ; see (Seuront 2010a) for
details. Statistically inferring the absence of significant
differences between fractal dimensions returned by different methods of analysis hence constitutes an additional
guarantee of the trustworthiness of the fractal dimension
estimates.
2.2.2 The Fractal Nature of Copepod
Temporal Patterns
One of the most extensively used techniques to
detect temporal self-affine patterns is power
spectral analysis. Formally, a power spectrum is
defined as the square of the amplitude of the
Fourier transform of a time series of a descriptor;
it is hence an expression of the variance of the
descriptor at different temporal scales. In practice, the power spectral density E(f) is given by
E f
f
( )∝
−β , where f is the frequency (s
−1
; f = 1/t,
where t is time). The spectral exponent β is estimated as the slope of a log-log plot of E(f) vs. f.
Specifically, the value of the exponent β provides
an efficient way to classify the type of motion
behaviour exhibited by zooplankton organisms.
2
Spectral analysis has still barely been used in
zooplankton behavioural ecology (Uttieri et al.
2008; Dur et al. 2010) but nevertheless suggests
2 Brownian motion (i.e. normal diffusion) is characterised
by β = 2. Anti-persistent and persistent fractional Brownian
motions are characterised by β < 2 and β > 2, respectively.
Specifically, a motion is persistent in the sense that an
organism moving in some direction at time t will tend to
move in the same direction at the next time step.
Fig. 3 The fractal dimension D (a) and stress index ϕ (b)
estimated from the swimming behaviour of Eurytemora
affinis adult males (black) and non-ovigerous females
(grey) in control uncontaminated estuarine water and in
estuarine water contaminated with the water-soluble fraction of diesel oil at 0.01, 0.1 and 1 % (Modified from
Seuront 2010a, b). (c) The multifractal function ζ(q)
allows to identify a range of movement behaviour (see
text for details) such as ballistic motion (dotted blue line),
Brownian motion (red dashed line), optimal Lévy flight
(black dots) and multifractal random walk (continuous
green curve) (Modified from Seuront and Stanley 2014)
When Complexity Rimes with Sanity: Loss of Fractal and Multifractal Behavioural…