

5.3 Analysis of the International Expenditures In 1995
133
conserved accessions is US $ 630, which makes it the highest ratio and is not very
attractive financially. The high ratio can most likely be explained by assuming that
the study included expenditures for breeding activities which are not plain
conservation activities.
Additionally, 80% of their member companies are participating in national
programs and 31 % in international programs for conservation and utilization of
PGRF A, whereby the financial participation was higher than US $ 1.5 million in
1996 (CGRF A, 1997). The total flow of official development assistance has been
falling in recent years, as has the share of agriculture in total development finance.
After the food crisis in the early 1970' s annual commitments rose to around US $
10 billion (in current value). This increased to about US $ 14 billion by the end of
the 1980s. There has, however, been a steady decline since then, falling to around
US $ 10 billion at present (UN, 1995). So, if financial assistance is assumed to be
approximately US $ 190 million, it makes up 2% of the overall ODA for
agriculture.
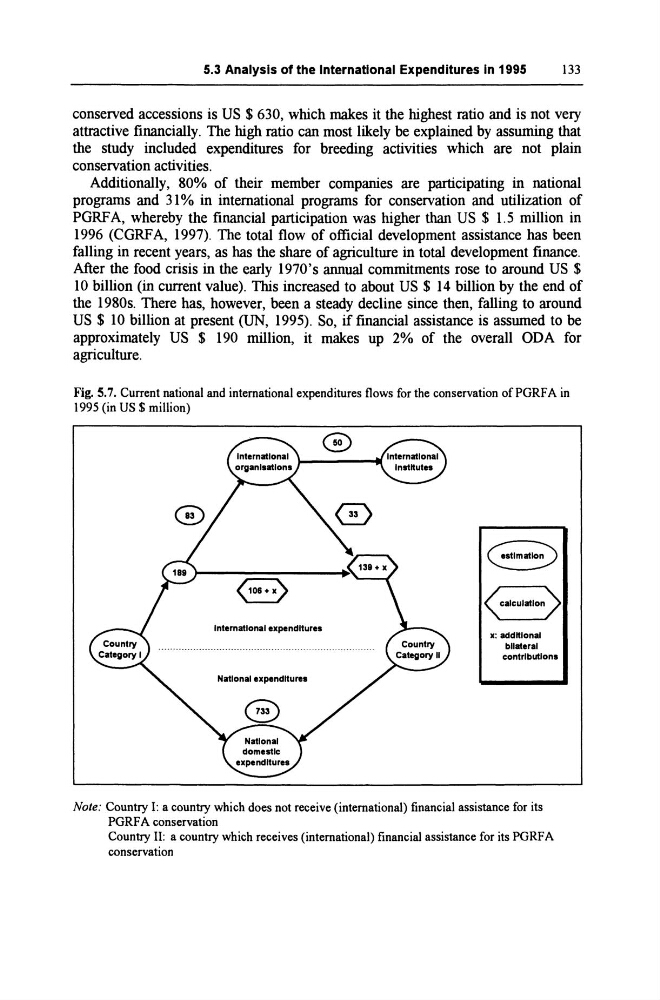
Fig. 5.7. Current national and international expenditures flows for the conservation of PGRF A in
1995 (in US $ million)
International expenditure.
NaUonal expendltu,"
1< calculation>
x: additional
bilateral
contributions
Note: Country I: a country which does not receive (international) financial assistance for its
PGRF A conservation
Country II: a country which receives (international) financial assistance for its PGRFA
conservation
133
conserved accessions is US $ 630, which makes it the highest ratio and is not very
attractive financially. The high ratio can most likely be explained by assuming that
the study included expenditures for breeding activities which are not plain
conservation activities.
Additionally, 80% of their member companies are participating in national
programs and 31 % in international programs for conservation and utilization of
PGRF A, whereby the financial participation was higher than US $ 1.5 million in
1996 (CGRF A, 1997). The total flow of official development assistance has been
falling in recent years, as has the share of agriculture in total development finance.
After the food crisis in the early 1970' s annual commitments rose to around US $
10 billion (in current value). This increased to about US $ 14 billion by the end of
the 1980s. There has, however, been a steady decline since then, falling to around
US $ 10 billion at present (UN, 1995). So, if financial assistance is assumed to be
approximately US $ 190 million, it makes up 2% of the overall ODA for
agriculture.
Fig. 5.7. Current national and international expenditures flows for the conservation of PGRF A in
1995 (in US $ million)
International expenditure.
NaUonal expendltu,"
1< calculation>
x: additional
bilateral
contributions
Note: Country I: a country which does not receive (international) financial assistance for its
PGRF A conservation
Country II: a country which receives (international) financial assistance for its PGRFA
conservation