

5.2 Expenditures of PGRFA Conservation
123
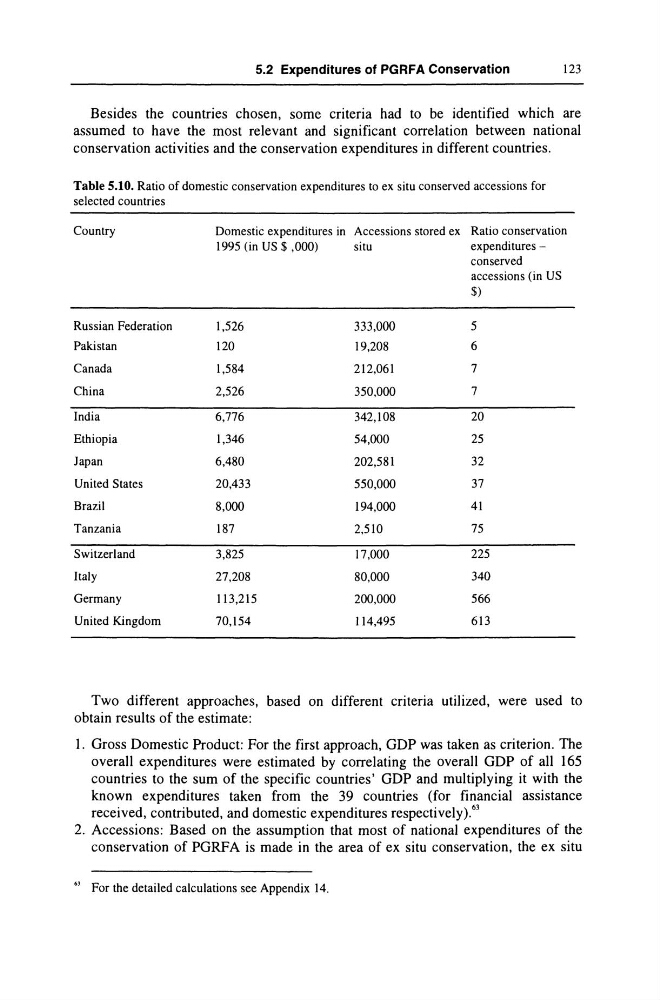
Besides the countries chosen, some criteria had to be identified which are
assumed to have the most relevant and significant correlation between national
conservation activities and the conservation expenditures in different countries.
Table 5.10. Ratio of domestic conservation expenditures to ex situ conserved accessions for
selected countries
Country
Domestic expenditures in Accessions stored ex Ratio conservation
1995 (in US $ ,000)
situ
expenditures -
conserved
accessions (in US
$)
Russian Federation
1,526
333,000
5
Pakistan
120
19,208
6
Canada
1,584
212,061
7
China
2,526
350,000
7
India
6,776
342,108
20
Ethiopia
1,346
54,000
25
Japan
6,480
202,581
32
United States
20,433
550,000
37
Brazil
8,000
194,000
41
Tanzania
187
2,510
75
Switzerland
3,825
17,000
225
Italy
27,208
80,000
340
Germany
113,215
200,000
566
United Kingdom
70,154
114,495
613
Two different approaches, based on different criteria utilized, were used to
obtain results of the estimate:
I. Gross Domestic Product: For the first approach, GDP was taken as criterion. The
overall expenditures were estimated by correlating the overall GDP of all 165
countries to the sum of the specific countries' GDP and multiplying it with the
known expenditures taken from the 39 countries (for financial assistance
received, contributed, and domestic expenditures respectively)."l
2. Accessions: Based on the assumption that most of national expenditures of the
conservation of PGRFA is made in the area of ex situ conservation, the ex situ
" For the detailed calculations see Appendix 14.
123
Besides the countries chosen, some criteria had to be identified which are
assumed to have the most relevant and significant correlation between national
conservation activities and the conservation expenditures in different countries.
Table 5.10. Ratio of domestic conservation expenditures to ex situ conserved accessions for
selected countries
Country
Domestic expenditures in Accessions stored ex Ratio conservation
1995 (in US $ ,000)
situ
expenditures -
conserved
accessions (in US
$)
Russian Federation
1,526
333,000
5
Pakistan
120
19,208
6
Canada
1,584
212,061
7
China
2,526
350,000
7
India
6,776
342,108
20
Ethiopia
1,346
54,000
25
Japan
6,480
202,581
32
United States
20,433
550,000
37
Brazil
8,000
194,000
41
Tanzania
187
2,510
75
Switzerland
3,825
17,000
225
Italy
27,208
80,000
340
Germany
113,215
200,000
566
United Kingdom
70,154
114,495
613
Two different approaches, based on different criteria utilized, were used to
obtain results of the estimate:
I. Gross Domestic Product: For the first approach, GDP was taken as criterion. The
overall expenditures were estimated by correlating the overall GDP of all 165
countries to the sum of the specific countries' GDP and multiplying it with the
known expenditures taken from the 39 countries (for financial assistance
received, contributed, and domestic expenditures respectively)."l
2. Accessions: Based on the assumption that most of national expenditures of the
conservation of PGRFA is made in the area of ex situ conservation, the ex situ
" For the detailed calculations see Appendix 14.