

Genotyping by Guanosine-Dependent Quenching of Single-Labeled Fluorescein Probes •
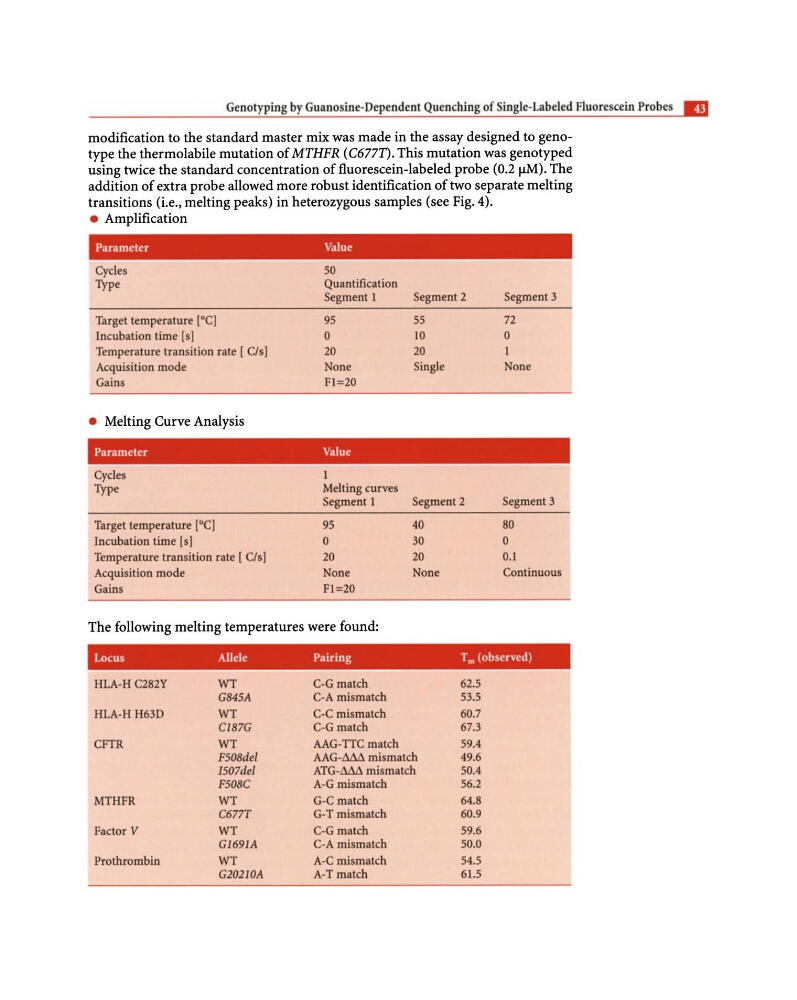
modification to the standard master mix was made in the assay designed to genotype the thermolabile mutation of MTHFR (C677T). This mutation was genotyped
using twice the standard concentration of fluorescein-labeled probe (0.2 flM). The
addition of extra probe allowed more robust identification of two separate melting
transitions (Le., melting peaks) in heterozygous samples (see Fig. 4) .
• Amplification
Parameter
Value
Cycles
Type
Target temperature lOG]
lncubation time (s]
Temperature transition rate I CIs]
Acquisition mode
Gains
• Melting Curve Analysis
50
Quantification
Segment 1
95
0
20
one
FI=20
Parameter
Value
Cycles
Type
Melting curves
Segment I
Ta.rget temperature [0C]
95
Incubation time [s]
0
Temperature transition rate I CIs]
20
Acquisition mode
one
Gains
FI=20
The following melting temperatures were found:
Segment 2
Segment 3
55
72
\0
0
20
Single
one
Segment 2
Segment 3
40
80
30
0
20
0.1
None
Continuous
Locus
Allele
Pairing
'I'm (observed)
HLA-H C282Y
WT
CoG match
62.5
GB45A
C-A mismatch
53.5
HLA-H H63D
WT
C-C mismatch
60.7
CIB7G
CoG match
67.3
CFTR
WT
AAG-TIC match
59.4
F50Bdei
AAG-l1..t:'.t1 mismatch
49.6
1507dei
ATG-~ mismatch
50.4
F50BC
A-G mismatch
56.2
MTHFR
WT
G-C match
64.B
C677T
G-T mismatch
60.9
Factor V
WT
CoG match
59.6
G1691A
C-A mismatch
50.0
Proth.rombin
WT
A-C mismatch
54.5
G202JOA
A-T match
61.5
modification to the standard master mix was made in the assay designed to genotype the thermolabile mutation of MTHFR (C677T). This mutation was genotyped
using twice the standard concentration of fluorescein-labeled probe (0.2 flM). The
addition of extra probe allowed more robust identification of two separate melting
transitions (Le., melting peaks) in heterozygous samples (see Fig. 4) .
• Amplification
Parameter
Value
Cycles
Type
Target temperature lOG]
lncubation time (s]
Temperature transition rate I CIs]
Acquisition mode
Gains
• Melting Curve Analysis
50
Quantification
Segment 1
95
0
20
one
FI=20
Parameter
Value
Cycles
Type
Melting curves
Segment I
Ta.rget temperature [0C]
95
Incubation time [s]
0
Temperature transition rate I CIs]
20
Acquisition mode
one
Gains
FI=20
The following melting temperatures were found:
Segment 2
Segment 3
55
72
\0
0
20
Single
one
Segment 2
Segment 3
40
80
30
0
20
0.1
None
Continuous
Locus
Allele
Pairing
'I'm (observed)
HLA-H C282Y
WT
CoG match
62.5
GB45A
C-A mismatch
53.5
HLA-H H63D
WT
C-C mismatch
60.7
CIB7G
CoG match
67.3
CFTR
WT
AAG-TIC match
59.4
F50Bdei
AAG-l1..t:'.t1 mismatch
49.6
1507dei
ATG-~ mismatch
50.4
F50BC
A-G mismatch
56.2
MTHFR
WT
G-C match
64.B
C677T
G-T mismatch
60.9
Factor V
WT
CoG match
59.6
G1691A
C-A mismatch
50.0
Proth.rombin
WT
A-C mismatch
54.5
G202JOA
A-T match
61.5