

Quantification of Cytokine mRNAs in Human Myocardial Biopsy Samples n
I'
nOt I
-.
,
•
I
•
,
•
,
-.
I
I
,
t
•
•
,
to
~
m
~
•
~
~
8
~
'-"'D
.(15 ... , • f ..- I '"
I · f I f " , • I I I I t I I • f ' f • I
a g m n n ~ ~ ~ ~ ~ E • ~ ~ ~
l _ _ rq
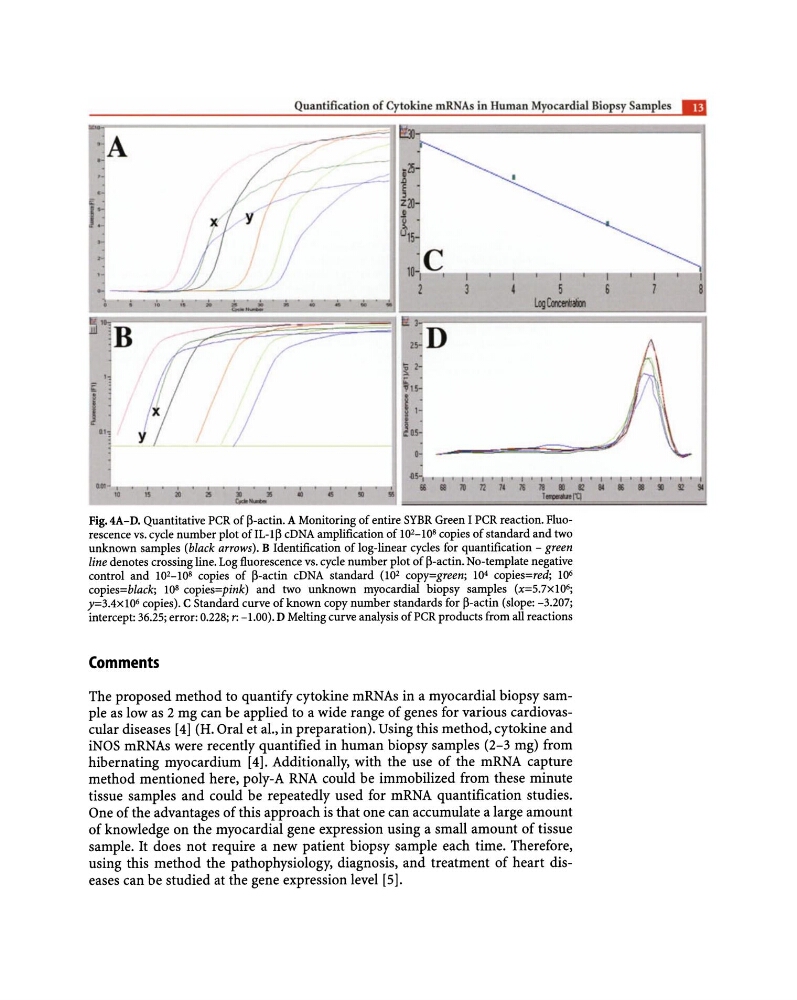
Fig.4A-D. Quantitative PCR of ~-actin. A Monitoring of entire SYBR Green I PCR reaction. Fluorescence vs. cycle number plot ofIL-1~ cDNA amplification of 10 2 -10 8 copies of standard and two
unknown samples (black arrows). B Identification of log-linear cycles for quantification - green
line denotes crossing line. Log fluorescence vs. cycle number plot of ~-actin. No-template negative
control and 10 2 -10 8 copies of ~-actin cDNA standard (10 2 copy=green; 10 4 copies=red; 10 6
copies=black; 108 copies=pink) and two unknown myocardial biopsy samples (x=5.7X10⁶;
y=3.4X10⁶ copies). C Standard curve of known copy number standards for ~-actin (slope: -3.207;
intercept: 36.25; error: 0.228; r: -1.00). D Melting curve analysis of PCR products from all reactions
Comments
The proposed method to quantify cytokine mRNAs in a myocardial biopsy sample as low as 2 mg can be applied to a wide range of genes for various cardiovascular diseases [4) (H. Oral et aI., in preparation). Using this method, cytokine and
iNOS mRNAs were recently quantified in human biopsy samples (2-3 mg) from
hibernating myocardium [4). Additionally, with the use of the mRNA capture
method mentioned here, poly-A RNA could be immobilized from these minute
tissue samples and could be repeatedly used for mRNA quantification studies.
One of the advantages of this approach is that one can accumulate a large amount
of knowledge on the myocardial gene expression using a small amount of tissue
sample. It does not require a new patient biopsy sample each time. Therefore,
using this method the pathophysiology, diagnosis, and treatment of heart diseases can be studied at the gene expression level [5).
I'
nOt I
-.
,
•
I
•
,
•
,
-.
I
I
,
t
•
•
,
to
~
m
~
•
~
~
8
~
'-"'D
.(15 ... , • f ..- I '"
I · f I f " , • I I I I t I I • f ' f • I
a g m n n ~ ~ ~ ~ ~ E • ~ ~ ~
l _ _ rq
Fig.4A-D. Quantitative PCR of ~-actin. A Monitoring of entire SYBR Green I PCR reaction. Fluorescence vs. cycle number plot ofIL-1~ cDNA amplification of 10 2 -10 8 copies of standard and two
unknown samples (black arrows). B Identification of log-linear cycles for quantification - green
line denotes crossing line. Log fluorescence vs. cycle number plot of ~-actin. No-template negative
control and 10 2 -10 8 copies of ~-actin cDNA standard (10 2 copy=green; 10 4 copies=red; 10 6
copies=black; 108 copies=pink) and two unknown myocardial biopsy samples (x=5.7X10⁶;
y=3.4X10⁶ copies). C Standard curve of known copy number standards for ~-actin (slope: -3.207;
intercept: 36.25; error: 0.228; r: -1.00). D Melting curve analysis of PCR products from all reactions
Comments
The proposed method to quantify cytokine mRNAs in a myocardial biopsy sample as low as 2 mg can be applied to a wide range of genes for various cardiovascular diseases [4) (H. Oral et aI., in preparation). Using this method, cytokine and
iNOS mRNAs were recently quantified in human biopsy samples (2-3 mg) from
hibernating myocardium [4). Additionally, with the use of the mRNA capture
method mentioned here, poly-A RNA could be immobilized from these minute
tissue samples and could be repeatedly used for mRNA quantification studies.
One of the advantages of this approach is that one can accumulate a large amount
of knowledge on the myocardial gene expression using a small amount of tissue
sample. It does not require a new patient biopsy sample each time. Therefore,
using this method the pathophysiology, diagnosis, and treatment of heart diseases can be studied at the gene expression level [5).