

Rapid Quantitative Detection of Free Cancer Cells in the PeritoneaJ Cavity of Gastric Cancer Patients IFD
A
1.0 -
0.8 -
--- _ •• _;.._.0:. __
GI
" ""
u
c 0.6 -
GI
u
UI
GI
~
0 0.4::J
iL
0.2 -
.' -.-:::::::;:::::: = :::~'-':::: ~
-'
0.0 -
0
10
20
30
40
50
Cycle N umber
B
36 -
32 -
~
E 28 -
::J
Z
GI
0 24 -
>.
U
20 -
16 -;
0.0
1.0
2.0
3.0
4.0
5.0
Log Concentration
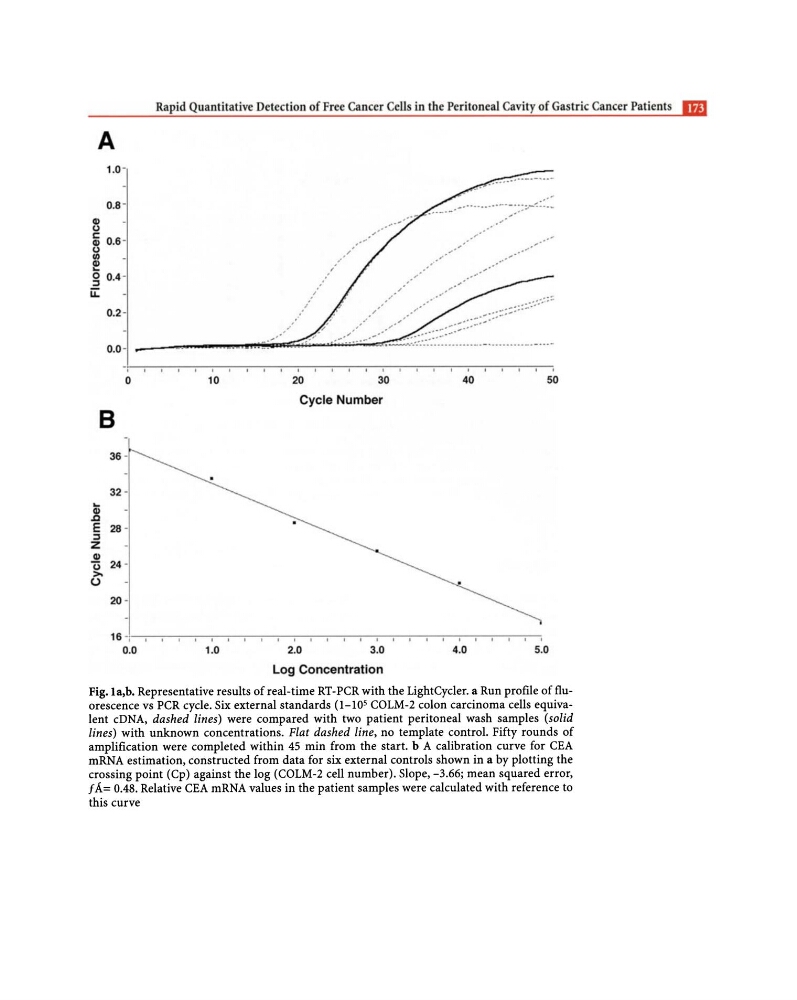
Fig.1a,b. Representative results of real-time RT-PCR with the LightCycler. a Run profile of fluorescence vs PCR cycle. Six external standards (1-10 5 COLM-2 colon carcinoma cells equivalent cDNA, dashed lines) were compared with two patient peritoneal wash samples (solid
lines) with unknown concentrations. Flat dashed line, no template control. Fifty rounds of
amplification were completed within 45 min from the start. b A calibration curve for CEA
mRNA estimation, constructed from data for six external controls shown in a by plotting the
crossing point (Cp) against the log (COLM-2 cell number). Slope, -3.66; mean squared error,
f A= 0.48. Relative CEA mRNA values in the patient samples were calculated with reference to
this curve
A
1.0 -
0.8 -
--- _ •• _;.._.0:. __
GI
" ""
u
c 0.6 -
GI
u
UI
GI
~
0 0.4::J
iL
0.2 -
.' -.-:::::::;:::::: = :::~'-':::: ~
-'
0.0 -
0
10
20
30
40
50
Cycle N umber
B
36 -
32 -
~
E 28 -
::J
Z
GI
0 24 -
>.
U
20 -
16 -;
0.0
1.0
2.0
3.0
4.0
5.0
Log Concentration
Fig.1a,b. Representative results of real-time RT-PCR with the LightCycler. a Run profile of fluorescence vs PCR cycle. Six external standards (1-10 5 COLM-2 colon carcinoma cells equivalent cDNA, dashed lines) were compared with two patient peritoneal wash samples (solid
lines) with unknown concentrations. Flat dashed line, no template control. Fifty rounds of
amplification were completed within 45 min from the start. b A calibration curve for CEA
mRNA estimation, constructed from data for six external controls shown in a by plotting the
crossing point (Cp) against the log (COLM-2 cell number). Slope, -3.66; mean squared error,
f A= 0.48. Relative CEA mRNA values in the patient samples were calculated with reference to
this curve