

"" Applications in Genetics
a) Genotyping of codon 49
15
3
t;; 2.5
; 2
A
r 0.5
0
.0.5 •
I
I
40
45
b) Genotyping of codon 89
/
/
0
I
55
T 8fI1I8IalI.te ('C)
c /
I
60
I
65
I
70
1:lC4.:J~-------=::.:=================================:::;1
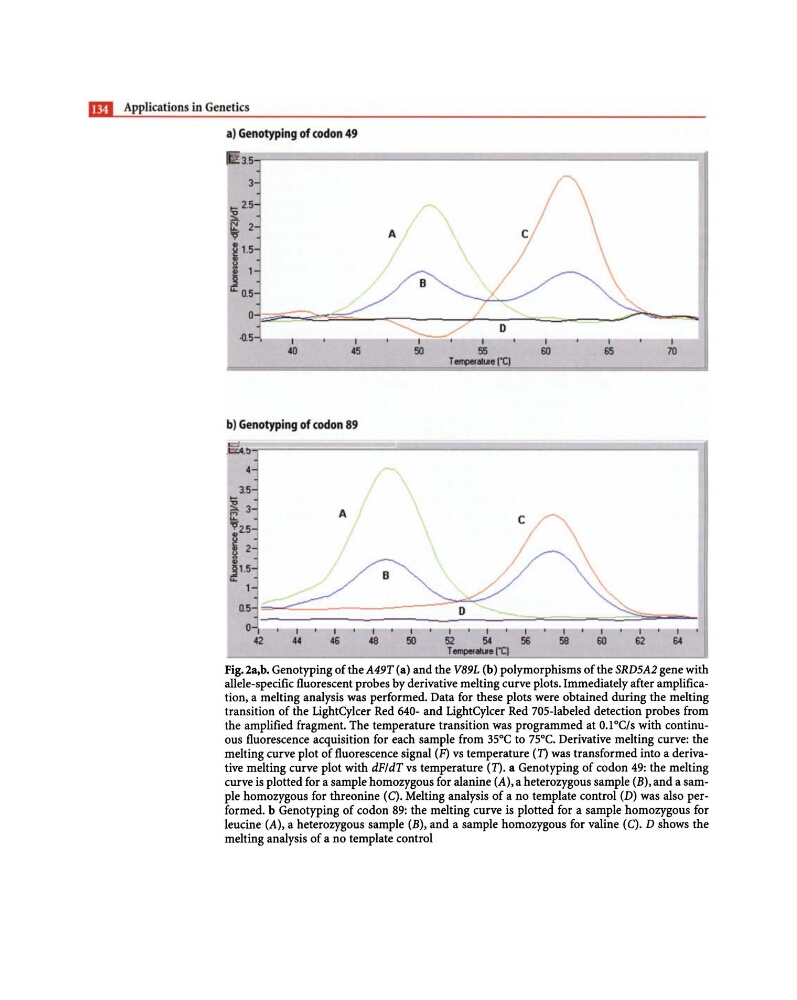
Fig.2a,b. Genotyping of the A49T (a) and the V89L (b) polymorphisms of the SRD5A2 gene with
allele-specific fluorescent probes by derivative melting curve plots. Immediately after amplification, a melting analysis was performed. Data for these plots were obtained during the melting
transition of the LightCylcer Red 640- and LightCylcer Red 70S-labeled detection probes from
the amplified fragment. The temperature transition was programmed at O.loC/s with continuous fluorescence acquisition for each sample from 35°C to 7SoC. Derivative melting curve: the
melting curve plot of fluorescence signal (F) vs temperature (T) was transformed into a derivative melting curve plot with dFldT vs temperature (T). a Genotyping of codon 49: the melting
curve is plotted for a sample homozygous for alanine (A), a heterozygous sample (B), and a sample homozygous for threonine (C). Melting analysis of a no template control (D) was also performed. b Genotyping of codon 89: the melting curve is plotted for a sample homozygous for
leucine (A), a heterozygous sample (B), and a sample homozygous for valine (C). D shows the
melting analysis of a no template control
a) Genotyping of codon 49
15
3
t;; 2.5
; 2
A
r 0.5
0
.0.5 •
I
I
40
45
b) Genotyping of codon 89
/
/
0
I
55
T 8fI1I8IalI.te ('C)
c /
I
60
I
65
I
70
1:lC4.:J~-------=::.:=================================:::;1
Fig.2a,b. Genotyping of the A49T (a) and the V89L (b) polymorphisms of the SRD5A2 gene with
allele-specific fluorescent probes by derivative melting curve plots. Immediately after amplification, a melting analysis was performed. Data for these plots were obtained during the melting
transition of the LightCylcer Red 640- and LightCylcer Red 70S-labeled detection probes from
the amplified fragment. The temperature transition was programmed at O.loC/s with continuous fluorescence acquisition for each sample from 35°C to 7SoC. Derivative melting curve: the
melting curve plot of fluorescence signal (F) vs temperature (T) was transformed into a derivative melting curve plot with dFldT vs temperature (T). a Genotyping of codon 49: the melting
curve is plotted for a sample homozygous for alanine (A), a heterozygous sample (B), and a sample homozygous for threonine (C). Melting analysis of a no template control (D) was also performed. b Genotyping of codon 89: the melting curve is plotted for a sample homozygous for
leucine (A), a heterozygous sample (B), and a sample homozygous for valine (C). D shows the
melting analysis of a no template control