

I'fD AppUcations in Genetics
1.3 -
,.-.
g I.' -
...
A
C.l
c
2S
'" ... u -
... <:>
::I
Ii:
... -
10
I.
13
11
26
JII
.l4
18
.2
.,
Cycle umber
.... -
GM ~
E."
~
0.30 -
B !::=.
i' 0.21 -
OJ
' "'
c
2S
.... -
'"
~
e Q
-:I
....
ii:
,
.. .. "
52
54
>6
"
60
'n
6<
. . .. ,.
Temperature (OC)
M
2
3
4
M
c
- - 18Sbp
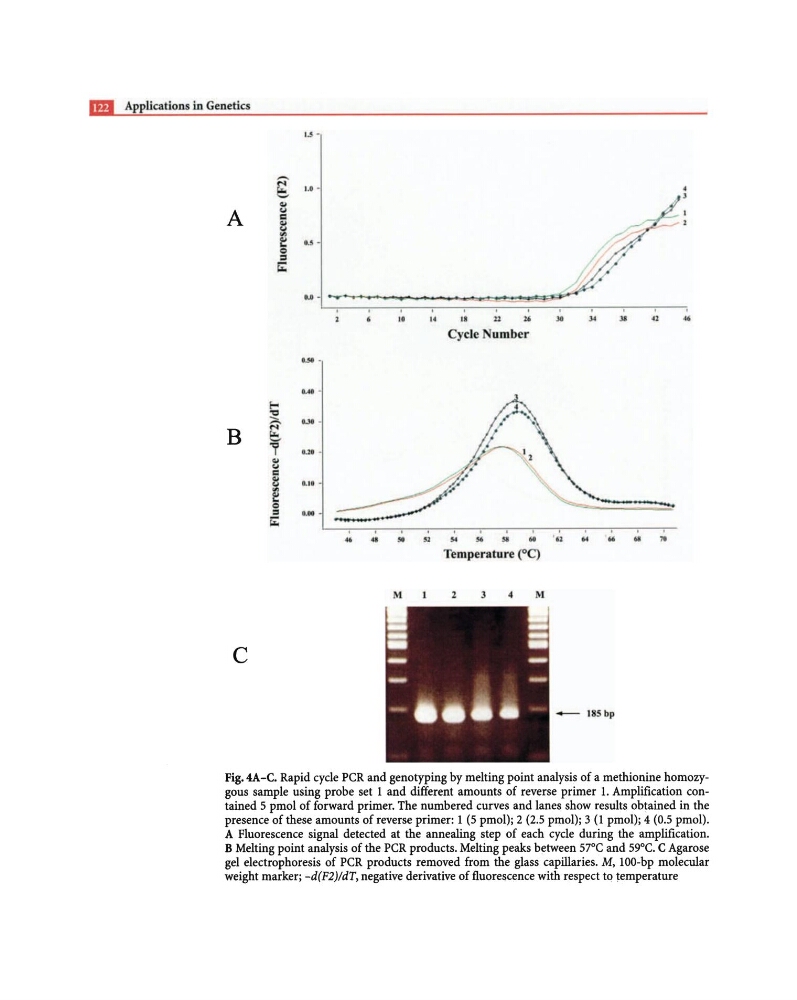
Fig.4A-C. Rapid cycle PCR and genotyping by melting point analysis of a methionine homozygous sample using probe set 1 and different amounts of reverse primer 1. Amplification contained 5 pmol of forward primer. The numbered curves and lanes show results obtained in the
presence of these amounts of reverse primer: 1 (5 pmol); 2 (2.5 pmol); 3 (1 pmol); 4 (0.5 pmol).
A Fluorescence signal detected at the annealing step of each cycle during the amplification.
B Melting point analysis of the PCR products. Melting peaks between 57°C and 59°C. C Agarose
gel electrophoresis of PCR products removed from the glass capillaries. M, 100-bp molecular
weight marker; -d(F2)/dT, negative derivative of fluorescence with respect to temperature
1.3 -
,.-.
g I.' -
...
A
C.l
c
2S
'" ... u -
... <:>
::I
Ii:
... -
10
I.
13
11
26
JII
.l4
18
.2
.,
Cycle umber
.... -
GM ~
E."
~
0.30 -
B !::=.
i' 0.21 -
OJ
' "'
c
2S
.... -
'"
~
e Q
-:I
....
ii:
,
.. .. "
52
54
>6
"
60
'n
6<
. . .. ,.
Temperature (OC)
M
2
3
4
M
c
- - 18Sbp
Fig.4A-C. Rapid cycle PCR and genotyping by melting point analysis of a methionine homozygous sample using probe set 1 and different amounts of reverse primer 1. Amplification contained 5 pmol of forward primer. The numbered curves and lanes show results obtained in the
presence of these amounts of reverse primer: 1 (5 pmol); 2 (2.5 pmol); 3 (1 pmol); 4 (0.5 pmol).
A Fluorescence signal detected at the annealing step of each cycle during the amplification.
B Melting point analysis of the PCR products. Melting peaks between 57°C and 59°C. C Agarose
gel electrophoresis of PCR products removed from the glass capillaries. M, 100-bp molecular
weight marker; -d(F2)/dT, negative derivative of fluorescence with respect to temperature