

m Applications in Genetics
~
~
C\I
u..
- 'a I
0 .7AA
GG
020 .0 -
~1-1,-----~1----7 1 --~71----~ 1 ----~ , ----7,----~1----~1----~1----~,----~,----~,----~ , ----~,--~'
60.0
62.0
114.0
60.0
58 .0
00.0
e2 0
114.0
III! 0
58 0
70.0
720
74.0
70.0
780
80.0
Temperature (O C)
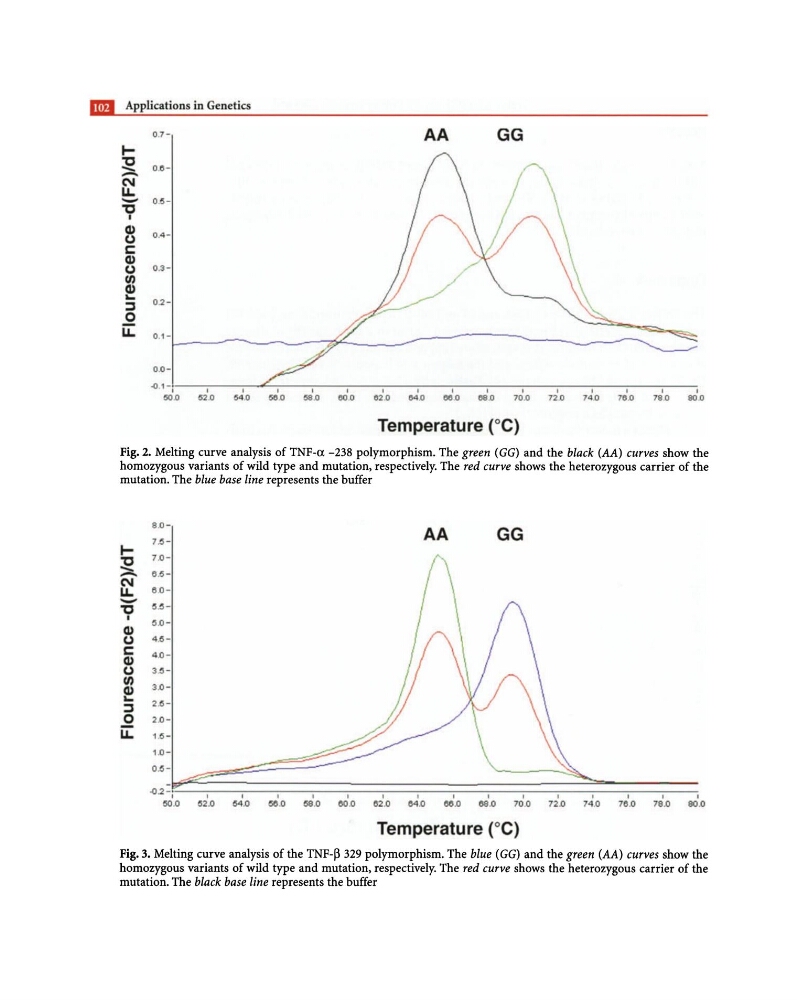
Fig. 2. Melting curve analysis of TNF-a. -238 polymorphism. The green (GG) and the black (AA) curves show the
homozygous variants of wild type and mutation, respectively. The red curve shows the heterozygous carrier of the
mutation. The blue base line represents the buffer
8.0 -
7.0 -
AA
GG
~
7.0~ 0.6 -
C\I
u.. 60- 'a
~.o -
I
~ .o -
(1)
CJ
4.6 -
C
4 .0(1)
CJ
3.0I/J
3.0 -
(1)
~
2 .~:l
0
2.0u:: 1.6 -
0.0~.2- ,
,
,
I
I
I
I
I
I
I
I
I
I
I
I
I
60.0
02.0
04.0
60.0
08.0
00 .0
02.0
04 .0
00.0
00.0
70 .0
72.0
74.0
70.0
70.0
80.0
Temperature (O C)
Fig. 3. Melting curve analysis of the TNF-~ 329 polymorphism. The blue (GG) and the green (AA) curves show the
homozygous variants of wild type and mutation, respectively. The red curve shows the heterozygous carrier of the
mutation. The black base line represents the buffer
~
~
C\I
u..
- 'a I
0 .7AA
GG
020 .0 -
~1-1,-----~1----7 1 --~71----~ 1 ----~ , ----7,----~1----~1----~1----~,----~,----~,----~ , ----~,--~'
60.0
62.0
114.0
60.0
58 .0
00.0
e2 0
114.0
III! 0
58 0
70.0
720
74.0
70.0
780
80.0
Temperature (O C)
Fig. 2. Melting curve analysis of TNF-a. -238 polymorphism. The green (GG) and the black (AA) curves show the
homozygous variants of wild type and mutation, respectively. The red curve shows the heterozygous carrier of the
mutation. The blue base line represents the buffer
8.0 -
7.0 -
AA
GG
~
7.0~ 0.6 -
C\I
u.. 60- 'a
~.o -
I
~ .o -
(1)
CJ
4.6 -
C
4 .0(1)
CJ
3.0I/J
3.0 -
(1)
~
2 .~:l
0
2.0u:: 1.6 -
0.0~.2- ,
,
,
I
I
I
I
I
I
I
I
I
I
I
I
I
60.0
02.0
04.0
60.0
08.0
00 .0
02.0
04 .0
00.0
00.0
70 .0
72.0
74.0
70.0
70.0
80.0
Temperature (O C)
Fig. 3. Melting curve analysis of the TNF-~ 329 polymorphism. The blue (GG) and the green (AA) curves show the
homozygous variants of wild type and mutation, respectively. The red curve shows the heterozygous carrier of the
mutation. The black base line represents the buffer