

485
Fluorescent Dissolved Organic Matter in Natural Waters
(275/357 nm in Milli-Q water); at 275–280/322–336 and 220–230/328–334 nm in
tryptophan extracted from EPS; at 275–285/330–351 and 225–235/338–351 nm in
various freshwaters; at 275–290/339–360 and 230/340 nm in sewerage samples and
drainking water treatment plants; at 280/338–368 and 240/368 nm in estuaries; at
280–295/330–340 nm in bay and coastal waters; at 270–280/320–350 nm in marine
waters; at 280/348 and <250/348 nm in ice samples from the Antarctic and Arctic
ocean; at 280/330–340 nm in soil; at 280/340 and 220/340 nm in compost products solutions; and at 270/354 nm in plant biomass, animal manure and soil (Coble
1996; Parlanti et al. 2000; Yamashita and Tanoue 2003a; Mostofa et al. 2005a,
2010; Stedmon et al. 2003; Stedmon and Markager 2005a, 2005b; Ohno and Bro
2006; Nakajima 2006; Baker 2005; Zhang et al. 2010; Provenzano et al. 2004; Lu
and Allen 2002; Dubnick et al. 2010; Fellman et al. 2008, 2009, 2010; Guo et al.
2010; Yu et al. 2010; Wu et al. 2011; Yamashita et al. 2011; Holbrook et al. 2006;
-
NH
CH2
CH
NH3
CO2
+
-
NH
CH2
CH
NH3
CO2
+
NH 3
+
CH
CO 2
-
NH 2
CH
CO 2 H
…...
…
.
(r)
(o)
(p)
(q)
Peak T
Peak TUV
400
365
330
295
260
235
250 300 350 400 450 500
Ex wavelength (nm)
Em wavelength (nm)
Peak T
Peak T UV
(s)
(t)
400
365
330
295
260
235
Ex wavelength (nm)
250 300 350 400 450 500
Em wavelength (nm)
Peak T
Peak T UV
(u)
(v)
(x)
(w)
Peak W
Peak A
250
300
350
300
350
400
450
300
350
300
350
400
450
250
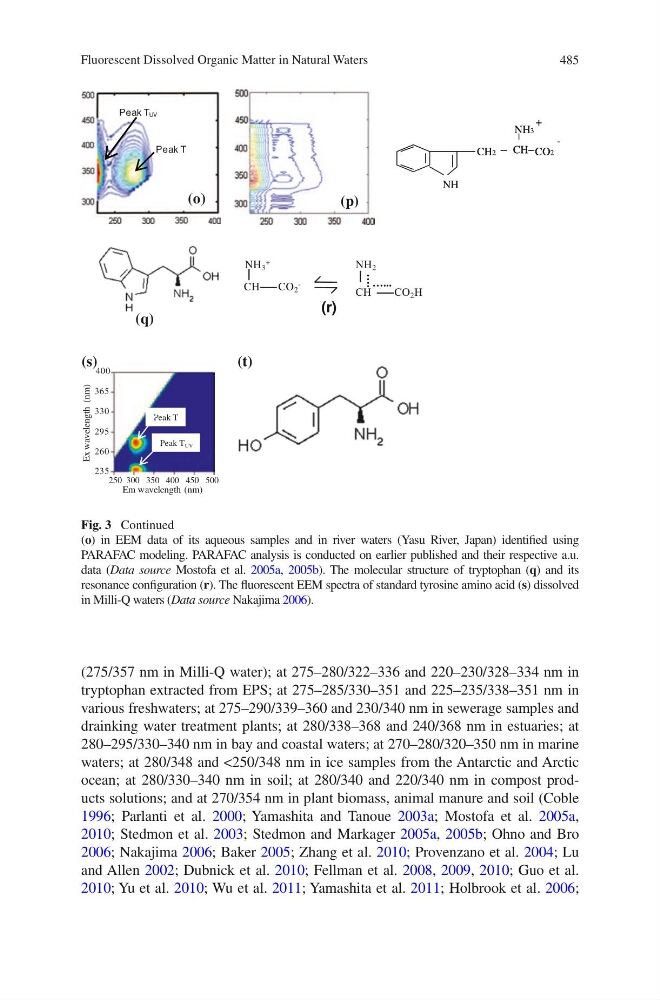
(o) in EEM data of its aqueous samples and in river waters (Yasu River, Japan) identified using
PARAFAC modeling. PARAFAC analysis is conducted on earlier published and their respective a.u.
data (Data source Mostofa et al. 2005a, 2005b). The molecular structure of tryptophan (q) and its
resonance configuration (r). The fluorescent EEM spectra of standard tyrosine amino acid (s) dissolved
in Milli-Q waters (Data source Nakajima 2006).
Fig. 3 Continued
Fluorescent Dissolved Organic Matter in Natural Waters
(275/357 nm in Milli-Q water); at 275–280/322–336 and 220–230/328–334 nm in
tryptophan extracted from EPS; at 275–285/330–351 and 225–235/338–351 nm in
various freshwaters; at 275–290/339–360 and 230/340 nm in sewerage samples and
drainking water treatment plants; at 280/338–368 and 240/368 nm in estuaries; at
280–295/330–340 nm in bay and coastal waters; at 270–280/320–350 nm in marine
waters; at 280/348 and <250/348 nm in ice samples from the Antarctic and Arctic
ocean; at 280/330–340 nm in soil; at 280/340 and 220/340 nm in compost products solutions; and at 270/354 nm in plant biomass, animal manure and soil (Coble
1996; Parlanti et al. 2000; Yamashita and Tanoue 2003a; Mostofa et al. 2005a,
2010; Stedmon et al. 2003; Stedmon and Markager 2005a, 2005b; Ohno and Bro
2006; Nakajima 2006; Baker 2005; Zhang et al. 2010; Provenzano et al. 2004; Lu
and Allen 2002; Dubnick et al. 2010; Fellman et al. 2008, 2009, 2010; Guo et al.
2010; Yu et al. 2010; Wu et al. 2011; Yamashita et al. 2011; Holbrook et al. 2006;
-
NH
CH2
CH
NH3
CO2
+
-
NH
CH2
CH
NH3
CO2
+
NH 3
+
CH
CO 2
-
NH 2
CH
CO 2 H
…...
…
.
(r)
(o)
(p)
(q)
Peak T
Peak TUV
400
365
330
295
260
235
250 300 350 400 450 500
Ex wavelength (nm)
Em wavelength (nm)
Peak T
Peak T UV
(s)
(t)
400
365
330
295
260
235
Ex wavelength (nm)
250 300 350 400 450 500
Em wavelength (nm)
Peak T
Peak T UV
(u)
(v)
(x)
(w)
Peak W
Peak A
250
300
350
300
350
400
450
300
350
300
350
400
450
250
(o) in EEM data of its aqueous samples and in river waters (Yasu River, Japan) identified using
PARAFAC modeling. PARAFAC analysis is conducted on earlier published and their respective a.u.
data (Data source Mostofa et al. 2005a, 2005b). The molecular structure of tryptophan (q) and its
resonance configuration (r). The fluorescent EEM spectra of standard tyrosine amino acid (s) dissolved
in Milli-Q waters (Data source Nakajima 2006).
Fig. 3 Continued