

380
K. M. G. Mostofa et al.
proteins and some anthropogenic compounds (such as fluorescent whitening
agents and detergents) in natural waters (Coble 2007; Coble 1996; Yamashita
and Tanoue 2003; Mostofa and Sakugawa 2009; Mostofa et al. 2010). These substances have fluorescence peaks at specific excitation-emission maxima, namely
in the C-, A-, T- and T UV -regions. Allochthounous fulvic and humic acids show
absorption over the entire spectrum (250–700 nm), with a small peak shoulder
for humic acid of 50–100 kDa (Fig. 3) (Ishiwatari 1973; Hayase and Tsubota
1985). The absorption coefficient (l/g/cm) of extracted humic acid typically
decreases whilst that of fulvic acid increases with increasing molecular weight,
as already reported. In addition, allochthonous fulvic acids of upstream and
downstream waters generally show relatively high absorption at longer wavelengths (500–700 nm, see Fig. 1). Such absorption is either greatly decreased or
not detectable in lake and marine waters (Moran et al. 2000; Winter et al. 2007;
del Vecchio and Blough 2004; del Vecchio and Blough 2002; Belzile et al. 2002).
Autochthonous CDOM of algal origin shows strong absorption over the entire
250–700 nm spectrum, and the fluorescence excitation-emission maxima resemble
those of allochthonous fulvic acids in water (Fig. 4) (Zhang et al. 2009; Mostofa
et al. 2009; Zhang et al. 2009). The absorption of both allochthonous and autochthonous fluorescent substances is very variable at specific wavelengths because
these components can be significantly degraded by both photoinduced and microbial processes (Zhang et al. 2009; Moran et al. 2000; Winter et al. 2007; del
Vecchio and Blough 2004; del Vecchio and Blough 2002; Mostofa et al. 2007;
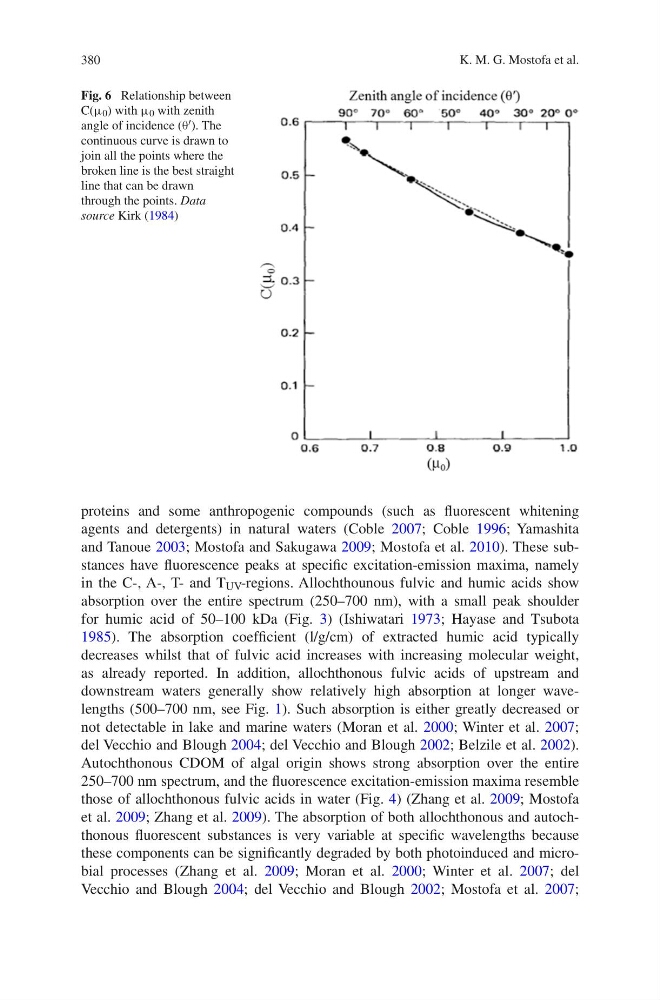
Fig. 6 Relationship between
C(μ 0 ) with μ 0 with zenith
angle of incidence (θ′). The
continuous curve is drawn to
join all the points where the
broken line is the best straight
line that can be drawn
through the points. Data
source Kirk (1984)
K. M. G. Mostofa et al.
proteins and some anthropogenic compounds (such as fluorescent whitening
agents and detergents) in natural waters (Coble 2007; Coble 1996; Yamashita
and Tanoue 2003; Mostofa and Sakugawa 2009; Mostofa et al. 2010). These substances have fluorescence peaks at specific excitation-emission maxima, namely
in the C-, A-, T- and T UV -regions. Allochthounous fulvic and humic acids show
absorption over the entire spectrum (250–700 nm), with a small peak shoulder
for humic acid of 50–100 kDa (Fig. 3) (Ishiwatari 1973; Hayase and Tsubota
1985). The absorption coefficient (l/g/cm) of extracted humic acid typically
decreases whilst that of fulvic acid increases with increasing molecular weight,
as already reported. In addition, allochthonous fulvic acids of upstream and
downstream waters generally show relatively high absorption at longer wavelengths (500–700 nm, see Fig. 1). Such absorption is either greatly decreased or
not detectable in lake and marine waters (Moran et al. 2000; Winter et al. 2007;
del Vecchio and Blough 2004; del Vecchio and Blough 2002; Belzile et al. 2002).
Autochthonous CDOM of algal origin shows strong absorption over the entire
250–700 nm spectrum, and the fluorescence excitation-emission maxima resemble
those of allochthonous fulvic acids in water (Fig. 4) (Zhang et al. 2009; Mostofa
et al. 2009; Zhang et al. 2009). The absorption of both allochthonous and autochthonous fluorescent substances is very variable at specific wavelengths because
these components can be significantly degraded by both photoinduced and microbial processes (Zhang et al. 2009; Moran et al. 2000; Winter et al. 2007; del
Vecchio and Blough 2004; del Vecchio and Blough 2002; Mostofa et al. 2007;
Fig. 6 Relationship between
C(μ 0 ) with μ 0 with zenith
angle of incidence (θ′). The
continuous curve is drawn to
join all the points where the
broken line is the best straight
line that can be drawn
through the points. Data
source Kirk (1984)