

340
K. M. G. Mostofa et al.
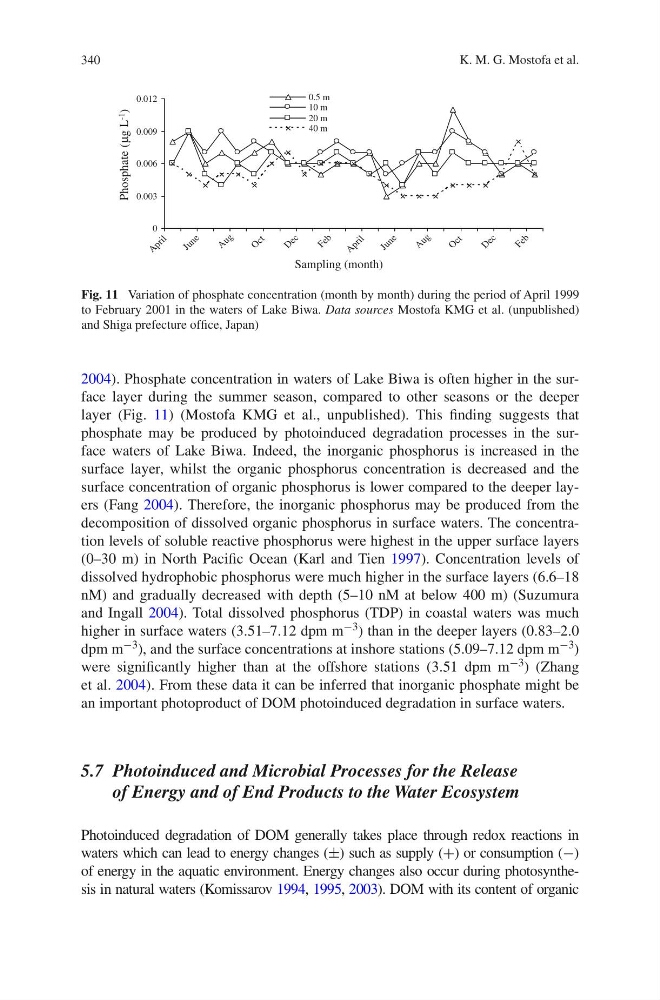
2004). Phosphate concentration in waters of Lake Biwa is often higher in the surface layer during the summer season, compared to other seasons or the deeper
layer (Fig. 11) (Mostofa KMG et al., unpublished). This finding suggests that
phosphate may be produced by photoinduced degradation processes in the surface waters of Lake Biwa. Indeed, the inorganic phosphorus is increased in the
surface layer, whilst the organic phosphorus concentration is decreased and the
surface concentration of organic phosphorus is lower compared to the deeper layers (Fang 2004). Therefore, the inorganic phosphorus may be produced from the
decomposition of dissolved organic phosphorus in surface waters. The concentration levels of soluble reactive phosphorus were highest in the upper surface layers
(0–30 m) in North Pacific Ocean (Karl and Tien 1997). Concentration levels of
dissolved hydrophobic phosphorus were much higher in the surface layers (6.6–18
nM) and gradually decreased with depth (5–10 nM at below 400 m) (Suzumura
and Ingall 2004). Total dissolved phosphorus (TDP) in coastal waters was much
higher in surface waters (3.51–7.12 dpm m −3 ) than in the deeper layers (0.83–2.0
dpm m −3 ), and the surface concentrations at inshore stations (5.09–7.12 dpm m −3 )
were significantly higher than at the offshore stations (3.51 dpm m −3 ) (Zhang
et al. 2004). From these data it can be inferred that inorganic phosphate might be
an important photoproduct of DOM photoinduced degradation in surface waters.
5.7 Photoinduced and Microbial Processes for the Release
of Energy and of End Products to the Water Ecosystem
Photoinduced degradation of DOM generally takes place through redox reactions in
waters which can lead to energy changes (±) such as supply (+) or consumption (−)
of energy in the aquatic environment. Energy changes also occur during photosynthesis in natural waters (Komissarov 1994, 1995, 2003). DOM with its content of organic
0
0.003
0.006
0.009
0.012
A
p r i l
J u n e
A
u g
O
c t
D
e c
F e b
A
p r i l
J u n e
A
u g
O
c t
D
e c
F e b
0.5 m
10 m
20 m
40 m
Phosphate
µg L -1
)
Sampling (month)
)
Fig. 11 Variation of phosphate concentration (month by month) during the period of April 1999
to February 2001 in the waters of Lake Biwa. Data sources Mostofa KMG et al. (unpublished)
and Shiga prefecture office, Japan)
K. M. G. Mostofa et al.
2004). Phosphate concentration in waters of Lake Biwa is often higher in the surface layer during the summer season, compared to other seasons or the deeper
layer (Fig. 11) (Mostofa KMG et al., unpublished). This finding suggests that
phosphate may be produced by photoinduced degradation processes in the surface waters of Lake Biwa. Indeed, the inorganic phosphorus is increased in the
surface layer, whilst the organic phosphorus concentration is decreased and the
surface concentration of organic phosphorus is lower compared to the deeper layers (Fang 2004). Therefore, the inorganic phosphorus may be produced from the
decomposition of dissolved organic phosphorus in surface waters. The concentration levels of soluble reactive phosphorus were highest in the upper surface layers
(0–30 m) in North Pacific Ocean (Karl and Tien 1997). Concentration levels of
dissolved hydrophobic phosphorus were much higher in the surface layers (6.6–18
nM) and gradually decreased with depth (5–10 nM at below 400 m) (Suzumura
and Ingall 2004). Total dissolved phosphorus (TDP) in coastal waters was much
higher in surface waters (3.51–7.12 dpm m −3 ) than in the deeper layers (0.83–2.0
dpm m −3 ), and the surface concentrations at inshore stations (5.09–7.12 dpm m −3 )
were significantly higher than at the offshore stations (3.51 dpm m −3 ) (Zhang
et al. 2004). From these data it can be inferred that inorganic phosphate might be
an important photoproduct of DOM photoinduced degradation in surface waters.
5.7 Photoinduced and Microbial Processes for the Release
of Energy and of End Products to the Water Ecosystem
Photoinduced degradation of DOM generally takes place through redox reactions in
waters which can lead to energy changes (±) such as supply (+) or consumption (−)
of energy in the aquatic environment. Energy changes also occur during photosynthesis in natural waters (Komissarov 1994, 1995, 2003). DOM with its content of organic
0
0.003
0.006
0.009
0.012
A
p r i l
J u n e
A
u g
O
c t
D
e c
F e b
A
p r i l
J u n e
A
u g
O
c t
D
e c
F e b
0.5 m
10 m
20 m
40 m
Phosphate
µg L -1
)
Sampling (month)
)
Fig. 11 Variation of phosphate concentration (month by month) during the period of April 1999
to February 2001 in the waters of Lake Biwa. Data sources Mostofa KMG et al. (unpublished)
and Shiga prefecture office, Japan)