

227
Photoinduced Generation of Hydroxyl Radical in Natural Waters
et al. 2004; Mostofa KMG and Sakugawa H, unpublished data; Nakatani et al.
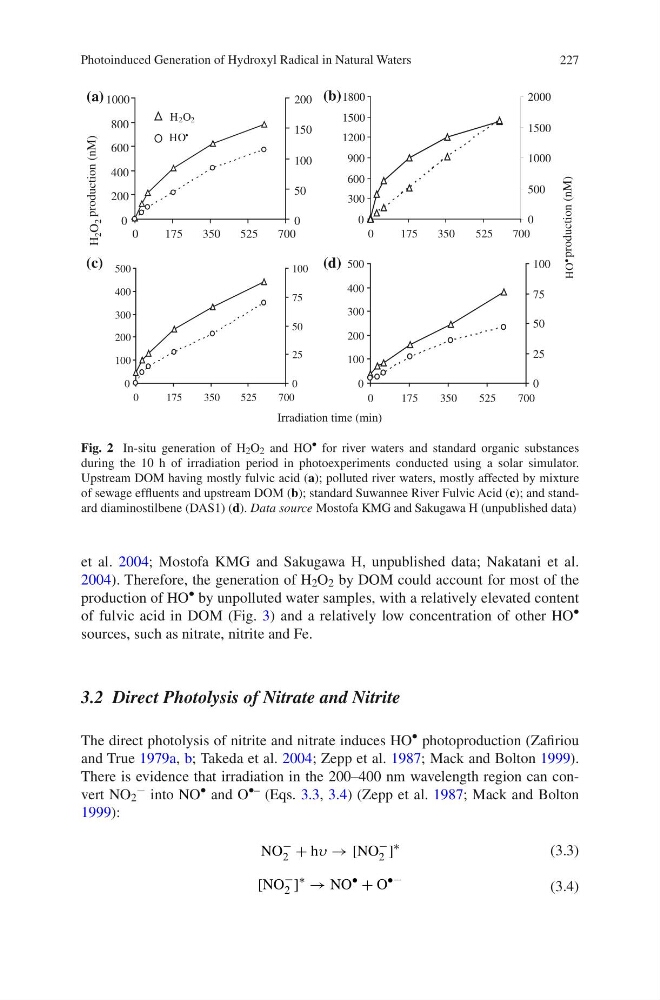
2004). Therefore, the generation of H 2 O 2 by DOM could account for most of the
production of HO
• by unpolluted water samples, with a relatively elevated content
of fulvic acid in DOM (Fig. 3) and a relatively low concentration of other HO
•
sources, such as nitrate, nitrite and Fe.
3.2 Direct Photolysis of Nitrate and Nitrite
The direct photolysis of nitrite and nitrate induces HO
• photoproduction (Zafiriou
and True 1979a, b; Takeda et al. 2004; Zepp et al. 1987; Mack and Bolton 1999).
There is evidence that irradiation in the 200–400 nm wavelength region can convert NO 2
− into NO
• and O
•– (Eqs. 3.3, 3.4) (Zepp et al. 1987; Mack and Bolton
1999):
(3.3)
NO
−
2 + hυ → [NO
−
2 ]
∗
(3.4)
[NO
−
2 ]
∗ → NO
• + O
•−
0
200
400
600
800
1000
0
175
350
525
700
0
50
100
150
200
0
300
600
900
1200
1500
1800
0
1 75
350
525
700
0
500
1000
1500
2000
0
100
200
300
400
500
0
175
350
525
700
0
25
50
75
100
0
100
200
300
400
500
0
1 75
350
525
700
0
25
50
75
100
H
O
•
(d)
(c)
(b)
(a)
H
2 O
2
production (nM)
production (nM)
Irradiation time (min)
H 2 O 2
HO •
Fig. 2 In-situ generation of H 2 O 2 and HO
• for river waters and standard organic substances
during the 10 h of irradiation period in photoexperiments conducted using a solar simulator.
Upstream DOM having mostly fulvic acid (a); polluted river waters, mostly affected by mixture
of sewage effluents and upstream DOM (b); standard Suwannee River Fulvic Acid (c); and standard diaminostilbene (DAS1) (d). Data source Mostofa KMG and Sakugawa H (unpublished data)
Photoinduced Generation of Hydroxyl Radical in Natural Waters
et al. 2004; Mostofa KMG and Sakugawa H, unpublished data; Nakatani et al.
2004). Therefore, the generation of H 2 O 2 by DOM could account for most of the
production of HO
• by unpolluted water samples, with a relatively elevated content
of fulvic acid in DOM (Fig. 3) and a relatively low concentration of other HO
•
sources, such as nitrate, nitrite and Fe.
3.2 Direct Photolysis of Nitrate and Nitrite
The direct photolysis of nitrite and nitrate induces HO
• photoproduction (Zafiriou
and True 1979a, b; Takeda et al. 2004; Zepp et al. 1987; Mack and Bolton 1999).
There is evidence that irradiation in the 200–400 nm wavelength region can convert NO 2
− into NO
• and O
•– (Eqs. 3.3, 3.4) (Zepp et al. 1987; Mack and Bolton
1999):
(3.3)
NO
−
2 + hυ → [NO
−
2 ]
∗
(3.4)
[NO
−
2 ]
∗ → NO
• + O
•−
0
200
400
600
800
1000
0
175
350
525
700
0
50
100
150
200
0
300
600
900
1200
1500
1800
0
1 75
350
525
700
0
500
1000
1500
2000
0
100
200
300
400
500
0
175
350
525
700
0
25
50
75
100
0
100
200
300
400
500
0
1 75
350
525
700
0
25
50
75
100
H
O
•
(d)
(c)
(b)
(a)
H
2 O
2
production (nM)
production (nM)
Irradiation time (min)
H 2 O 2
HO •
Fig. 2 In-situ generation of H 2 O 2 and HO
• for river waters and standard organic substances
during the 10 h of irradiation period in photoexperiments conducted using a solar simulator.
Upstream DOM having mostly fulvic acid (a); polluted river waters, mostly affected by mixture
of sewage effluents and upstream DOM (b); standard Suwannee River Fulvic Acid (c); and standard diaminostilbene (DAS1) (d). Data source Mostofa KMG and Sakugawa H (unpublished data)