

183
Photoinduced and Microbial Generation of Hydrogen Peroxide
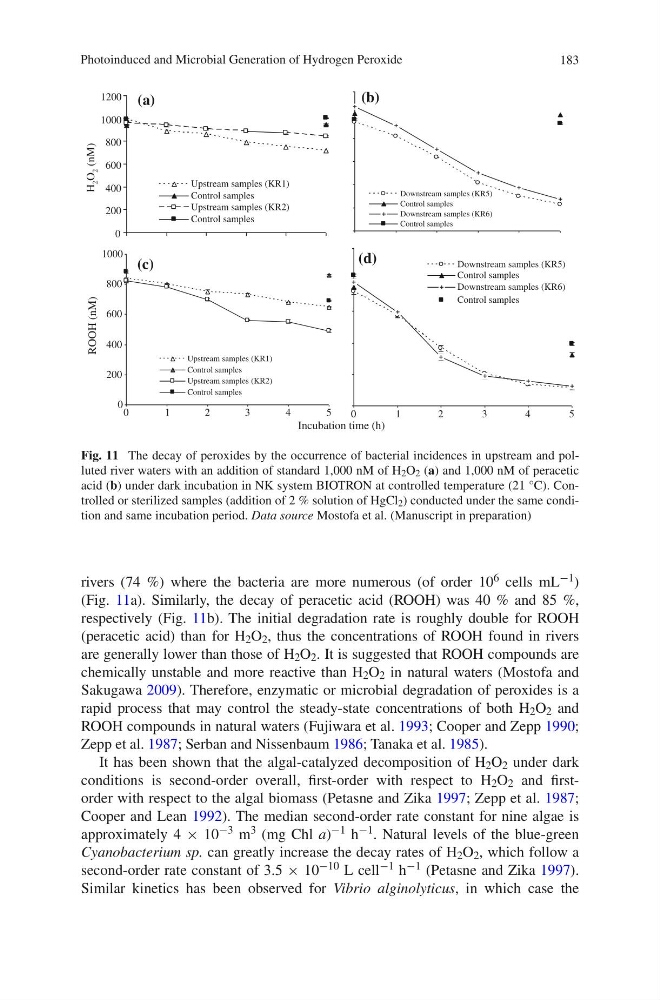
rivers (74 %) where the bacteria are more numerous (of order 10 6 cells mL −1 )
(Fig. 11a). Similarly, the decay of peracetic acid (ROOH) was 40 % and 85 %,
respectively (Fig. 11b). The initial degradation rate is roughly double for ROOH
(peracetic acid) than for H 2 O 2 , thus the concentrations of ROOH found in rivers
are generally lower than those of H 2 O 2 . It is suggested that ROOH compounds are
chemically unstable and more reactive than H 2 O 2 in natural waters (Mostofa and
Sakugawa 2009). Therefore, enzymatic or microbial degradation of peroxides is a
rapid process that may control the steady-state concentrations of both H 2 O 2 and
ROOH compounds in natural waters (Fujiwara et al. 1993; Cooper and Zepp 1990;
Zepp et al. 1987; Serban and Nissenbaum 1986; Tanaka et al. 1985).
It has been shown that the algal-catalyzed decomposition of H 2 O 2 under dark
conditions is second-order overall, first-order with respect to H 2 O 2 and firstorder with respect to the algal biomass (Petasne and Zika 1997; Zepp et al. 1987;
Cooper and Lean 1992). The median second-order rate constant for nine algae is
approximately 4 × 10 −3 m 3 (mg Chl a) −1 h −1 . Natural levels of the blue-green
Cyanobacterium sp. can greatly increase the decay rates of H 2 O 2 , which follow a
second-order rate constant of 3.5 × 10 −10 L cell −1 h −1 (Petasne and Zika 1997).
Similar kinetics has been observed for Vibrio alginolyticus, in which case the
0
200
400
600
800
1000
1200
Upstream samples (KR1)
Control samples
Upstream samples (KR2)
Control samples
(a)
Downstream samples (KR5)
Control samples
Downstream samples (KR6)
Control samples
(b)
0
200
400
600
800
1000
0
1
2
3
4
5
Upstream samples (KR1)
Control samples
Upstream samples (KR2)
Control samples
(c)
Incubation time (h)
H
2 O
2 (nM)
ROOH (nM)
0
1
2
3
4
5
Downstream samples (KR5)
Control samples
Downstream samples (KR6)
Control samples
(d)
Fig. 11 The decay of peroxides by the occurrence of bacterial incidences in upstream and polluted river waters with an addition of standard 1,000 nM of H 2 O 2 (a) and 1,000 nM of peracetic
acid (b) under dark incubation in NK system BIOTRON at controlled temperature (21 °C). Controlled or sterilized samples (addition of 2 % solution of HgCl 2 ) conducted under the same condition and same incubation period. Data source Mostofa et al. (Manuscript in preparation)
Photoinduced and Microbial Generation of Hydrogen Peroxide
rivers (74 %) where the bacteria are more numerous (of order 10 6 cells mL −1 )
(Fig. 11a). Similarly, the decay of peracetic acid (ROOH) was 40 % and 85 %,
respectively (Fig. 11b). The initial degradation rate is roughly double for ROOH
(peracetic acid) than for H 2 O 2 , thus the concentrations of ROOH found in rivers
are generally lower than those of H 2 O 2 . It is suggested that ROOH compounds are
chemically unstable and more reactive than H 2 O 2 in natural waters (Mostofa and
Sakugawa 2009). Therefore, enzymatic or microbial degradation of peroxides is a
rapid process that may control the steady-state concentrations of both H 2 O 2 and
ROOH compounds in natural waters (Fujiwara et al. 1993; Cooper and Zepp 1990;
Zepp et al. 1987; Serban and Nissenbaum 1986; Tanaka et al. 1985).
It has been shown that the algal-catalyzed decomposition of H 2 O 2 under dark
conditions is second-order overall, first-order with respect to H 2 O 2 and firstorder with respect to the algal biomass (Petasne and Zika 1997; Zepp et al. 1987;
Cooper and Lean 1992). The median second-order rate constant for nine algae is
approximately 4 × 10 −3 m 3 (mg Chl a) −1 h −1 . Natural levels of the blue-green
Cyanobacterium sp. can greatly increase the decay rates of H 2 O 2 , which follow a
second-order rate constant of 3.5 × 10 −10 L cell −1 h −1 (Petasne and Zika 1997).
Similar kinetics has been observed for Vibrio alginolyticus, in which case the
0
200
400
600
800
1000
1200
Upstream samples (KR1)
Control samples
Upstream samples (KR2)
Control samples
(a)
Downstream samples (KR5)
Control samples
Downstream samples (KR6)
Control samples
(b)
0
200
400
600
800
1000
0
1
2
3
4
5
Upstream samples (KR1)
Control samples
Upstream samples (KR2)
Control samples
(c)
Incubation time (h)
H
2 O
2 (nM)
ROOH (nM)
0
1
2
3
4
5
Downstream samples (KR5)
Control samples
Downstream samples (KR6)
Control samples
(d)
Fig. 11 The decay of peroxides by the occurrence of bacterial incidences in upstream and polluted river waters with an addition of standard 1,000 nM of H 2 O 2 (a) and 1,000 nM of peracetic
acid (b) under dark incubation in NK system BIOTRON at controlled temperature (21 °C). Controlled or sterilized samples (addition of 2 % solution of HgCl 2 ) conducted under the same condition and same incubation period. Data source Mostofa et al. (Manuscript in preparation)