

3. Irradiance and Lipid Production
65
E
20
De 15
;f!.
.., 10
'0.
:::;
•
.,.
/
.-" .
•
•
c
0
1l :::J
..,
e
D-5
•
OJ
I!! -10
«
•
•
15
;f!. ·15
•
..,
'5. -20
:::;
100
200
300
Day of the Year
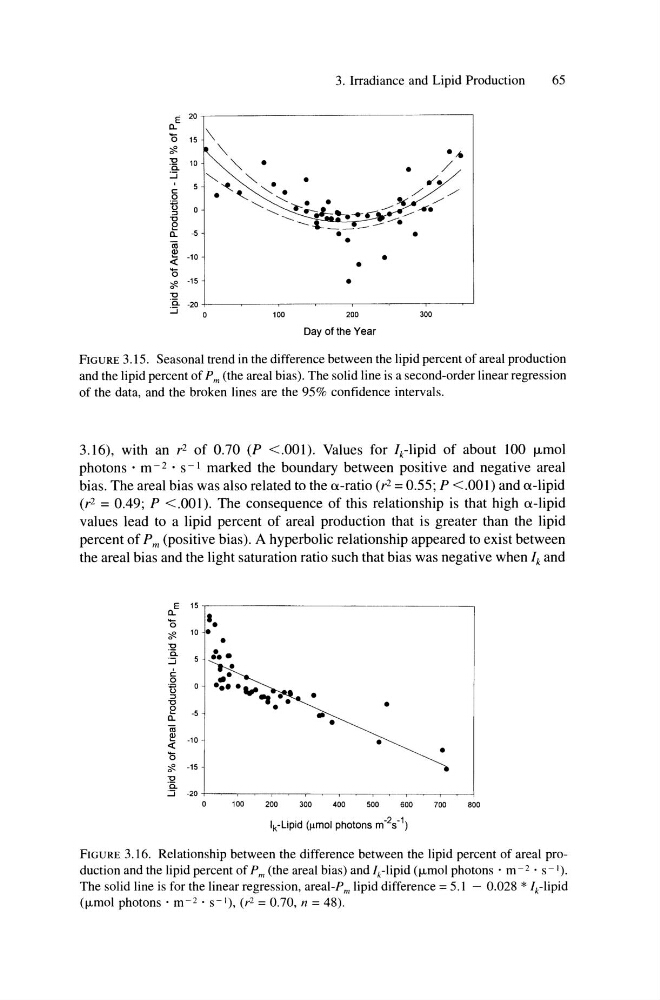
FIGURE 3.15. Seasonal trend in the difference between the lipid percent of areal production
and the lipid percent of Pm (the areal bias). The solid line is a second-order linear regression
of the data, and the broken lines are the 95% confidence intervals.
3.16), with an r2 of 0.70 (P <.001). Values for Ik-lipid of about 100 !-Lmol
photons' m - 2 • S - I marked the boundary between positive and negative areal
bias. The areal bias was also related to the a-ratio (r 2 = 0.55; P <.001) and a-lipid
(r2 = 0.49; P <.001). The consequence of this relationship is that high a-lipid
values lead to a lipid percent of areal production that is greater than the lipid
percent of Pm (positive bias). A hyperbolic relationship appeared to exist between
the areal bias and the light saturation ratio such that bias was negative when Ik and
E 15
DI.
15
;f!.
10
..,
'0.
:::;
Co
0
tl
•
:::J
..,
•
e -5
•
D•
"iii
I!! -10
•
«
15
•
~
0
-15
:2
c.
::; -20
0
100
200
300
400
500
600
700
BOD
Ik-Lipid ().lmol photons m- 2 s- 1 )
FIGURE 3.16. Relationship between the difference between the lipid percent of areal production and the lipid percent of Pm (the areal bias) and Ik-lipid (""mol photons' m -2 • S -I).
The solid line is for the linear regression, areal-Pm lipid difference = 5.1 - 0.028 * Ik-lipid
(""mol photons· m- 2 • S-I), (r 2 = 0.70, n = 48).
65
E
20
De 15
;f!.
.., 10
'0.
:::;
•
.,.
/
.-" .
•
•
c
0
1l :::J
..,
e
D-5
•
OJ
I!! -10
«
•
•
15
;f!. ·15
•
..,
'5. -20
:::;
100
200
300
Day of the Year
FIGURE 3.15. Seasonal trend in the difference between the lipid percent of areal production
and the lipid percent of Pm (the areal bias). The solid line is a second-order linear regression
of the data, and the broken lines are the 95% confidence intervals.
3.16), with an r2 of 0.70 (P <.001). Values for Ik-lipid of about 100 !-Lmol
photons' m - 2 • S - I marked the boundary between positive and negative areal
bias. The areal bias was also related to the a-ratio (r 2 = 0.55; P <.001) and a-lipid
(r2 = 0.49; P <.001). The consequence of this relationship is that high a-lipid
values lead to a lipid percent of areal production that is greater than the lipid
percent of Pm (positive bias). A hyperbolic relationship appeared to exist between
the areal bias and the light saturation ratio such that bias was negative when Ik and
E 15
DI.
15
;f!.
10
..,
'0.
:::;
Co
0
tl
•
:::J
..,
•
e -5
•
D•
"iii
I!! -10
•
«
15
•
~
0
-15
:2
c.
::; -20
0
100
200
300
400
500
600
700
BOD
Ik-Lipid ().lmol photons m- 2 s- 1 )
FIGURE 3.16. Relationship between the difference between the lipid percent of areal production and the lipid percent of Pm (the areal bias) and Ik-lipid (""mol photons' m -2 • S -I).
The solid line is for the linear regression, areal-Pm lipid difference = 5.1 - 0.028 * Ik-lipid
(""mol photons· m- 2 • S-I), (r 2 = 0.70, n = 48).