

58
B.C. Wainman et al.
between these methods for lipid extraction except that the combined ethanol,
ethanol:diethyl ether lipid solvent system used by Cuhel and Lean (1987a) and the
chloroform:methanol solvent used by Li and Platt (1982) yield crude lipid extracts
and likely overestimate lipid synthesis levels, perhaps by as much as 15% (Wainman and Lean, 1994).
Areal carbon fixation and fixation of carbon into lipid were estimated by
substituting calculated photosynthetic parameters (see above) into the modified
Tailing equation as suggested by Kirk (1983, Equation 11.5, p. 287). PAR was
estimated using the "YPHOTO" program of the "primary production model" of
Fee (1990).
3.3.2. Light Saturation Parameter, Ik
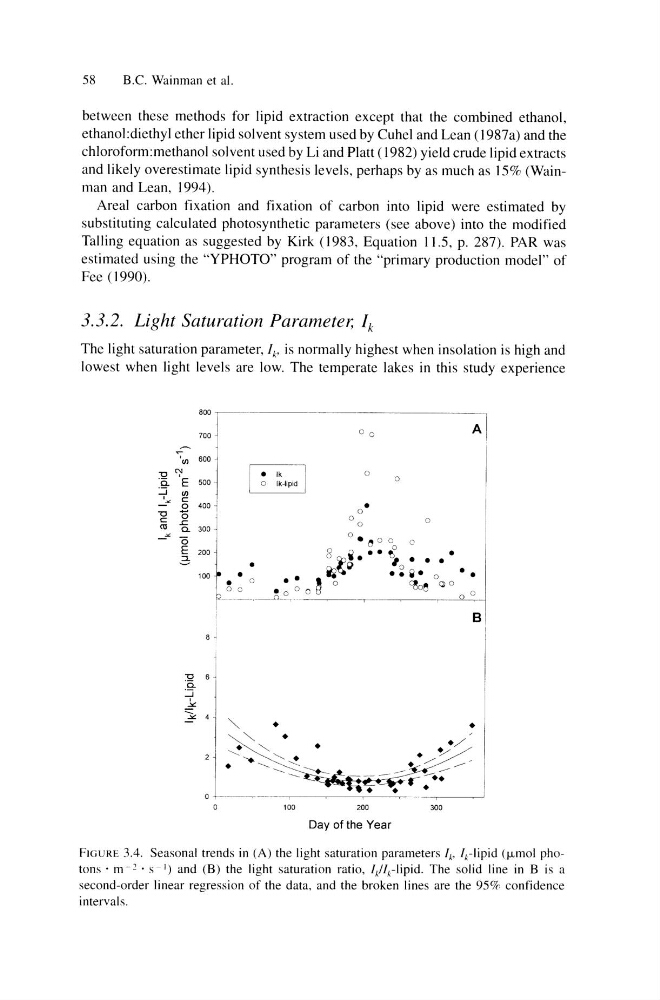
The light saturation parameter, I k • is normally highest when insolation is high and
lowest when light levels are low. The temperate lakes in this study experience
::r
c 0
AI
'";"
600
'"
"0 '")'
500 1
• Ik
0
0
Ci EO
0
Ik-lipid
::t '" c
~
0
400 l
•
"0
0
0
c
0
.r:
0
C1l
Q. 300·
~
(5
o. ~ 0 oJ
,
0
EO
~~~ .
• •
0
•
' T
~ ..
.3
•
•
100 0 ~ .. ;
• ; w· 0 • •
• •
r, ~
0
'&~ 'JI 0
• °
0
()
___ -0 __ . _
-------- ... _ 0 _ . _
B
Day of the Year
FIGURE 3.4. Seasonal trends in (Al the light saturation parameters Ik• Iclipid (J.Lmol photons' m -, . s - I) and (B) the light saturation ratio, I,j/clipid. The solid line in B is a
second-order linear regression of the data, and the broken lines are the 95% confidence
intervals.
B.C. Wainman et al.
between these methods for lipid extraction except that the combined ethanol,
ethanol:diethyl ether lipid solvent system used by Cuhel and Lean (1987a) and the
chloroform:methanol solvent used by Li and Platt (1982) yield crude lipid extracts
and likely overestimate lipid synthesis levels, perhaps by as much as 15% (Wainman and Lean, 1994).
Areal carbon fixation and fixation of carbon into lipid were estimated by
substituting calculated photosynthetic parameters (see above) into the modified
Tailing equation as suggested by Kirk (1983, Equation 11.5, p. 287). PAR was
estimated using the "YPHOTO" program of the "primary production model" of
Fee (1990).
3.3.2. Light Saturation Parameter, Ik
The light saturation parameter, I k • is normally highest when insolation is high and
lowest when light levels are low. The temperate lakes in this study experience
::r
c 0
AI
'";"
600
'"
"0 '")'
500 1
• Ik
0
0
Ci EO
0
Ik-lipid
::t '" c
~
0
400 l
•
"0
0
0
c
0
.r:
0
C1l
Q. 300·
~
(5
o. ~ 0 oJ
,
0
EO
~~~ .
• •
0
•
' T
~ ..
.3
•
•
100 0 ~ .. ;
• ; w· 0 • •
• •
r, ~
0
'&~ 'JI 0
• °
0
()
___ -0 __ . _
-------- ... _ 0 _ . _
B
Day of the Year
FIGURE 3.4. Seasonal trends in (Al the light saturation parameters Ik• Iclipid (J.Lmol photons' m -, . s - I) and (B) the light saturation ratio, I,j/clipid. The solid line in B is a
second-order linear regression of the data, and the broken lines are the 95% confidence
intervals.