

52
B.C. Wainman et al.
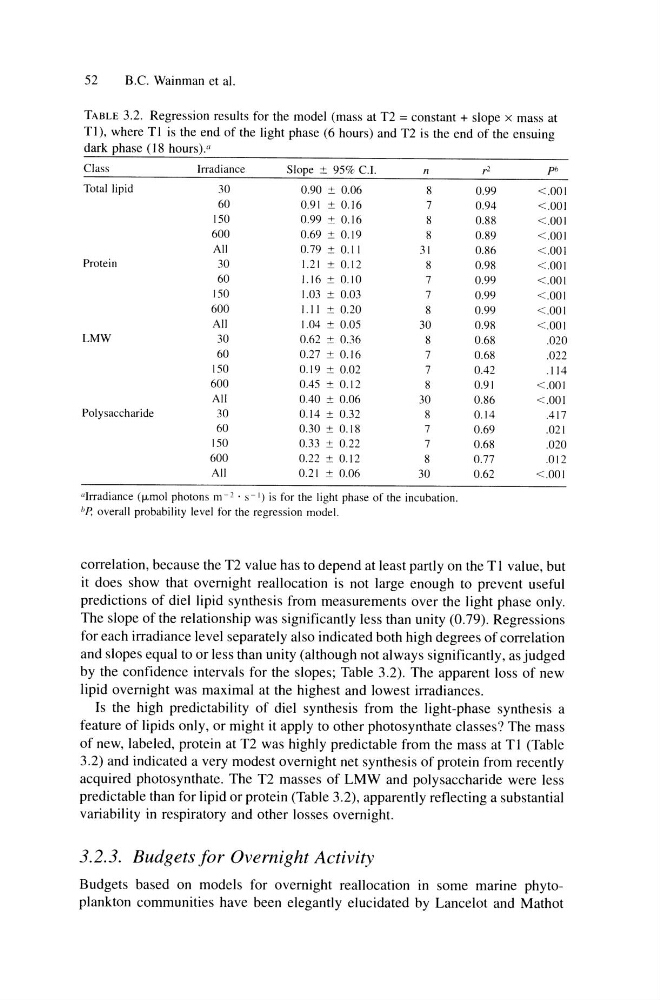
TABLE 3.2. Regression results for the model (mass at T2 = constant + slope x mass at
Tl), where Tl is the end of the light phase (6 hours) and T2 is the end of the ensuing
dark phase (18 hours).a
Class
Irradiance
Slope ± 95% c.r.
n
r'
ph
Total lipid
30
0.90 ± 0.06
8
0.99
<.001
60
0.91 ± 0.16
7
0.94
<.001
150
0.99 ± 0.16
8
0.88
<.001
600
0.69 ± 0.19
8
0.89
<.001
All
0.79 ± 0.11
31
0.86
<.001
Protein
30
1.21 ± 0.12
8
0.98
<.001
60
1.16 ± 0.10
7
0.99
<.001
150
1.03 ± 0.03
7
0.99
<.001
600
1.1 I ± 0.20
8
0.99
<.001
All
1.04 ± 0.05
30
0.98
<.001
LMW
30
0.62 ± 0.36
8
0.68
.020
60
0.27 ± 0.16
7
0.68
.022
150
0.19 ± 0.02
7
0.42
.114
600
0.45 ± 0.12
8
0.91
<.001
All
0.40 ± 0.06
30
0.86
<.001
Polysaccharide
30
0.14 ± 0.32
8
0.14
.417
60
0.30 ± 0.18
7
0.69
.021
150
0.33 ± 0.22
7
0.68
J)20
600
0.22 ± 0.12
8
0.77
.012
All
0.21 ± 0.06
30
0.62
<.001
"Irradiance (fLmol photons m- 2 • s-') is for the light phase of the incubation.
hP' overall probability level for the regression model.
correlation, because the T2 value has to depend at least partly on the Tl value, but
it does show that overnight reallocation is not large enough to prevent useful
predictions of diel lipid synthesis from measurements over the light phase only.
The slope of the relationship was significantly less than unity (0.79). Regressions
for each irradiance level separately also indicated both high degrees of correlation
and slopes equal to or less than unity (although not always significantly, as judged
by the confidence intervals for the slopes; Table 3.2). The apparent loss of new
lipid overnight was maximal at the highest and lowest irradiances.
Is the high predictability of diel synthesis from the light-phase synthesis a
feature of lipids only, or might it apply to other photosynthate classes? The mass
of new, labeled, protein at T2 was highly predictable from the mass at Tl (Table
3.2) and indicated a very modest overnight net synthesis of protein from recently
acquired photosynthate. The T2 masses of LMW and polysaccharide were less
predictable than for lipid or protein (Table 3.2), apparently reflecting a substantial
variability in respiratory and other losses overnight.
3.2.3. Budgets for Overnight Activity
Budgets based on models for overnight reallocation In some marine phytoplankton communities have been elegantly elucidated by Lancelot and Mathot
B.C. Wainman et al.
TABLE 3.2. Regression results for the model (mass at T2 = constant + slope x mass at
Tl), where Tl is the end of the light phase (6 hours) and T2 is the end of the ensuing
dark phase (18 hours).a
Class
Irradiance
Slope ± 95% c.r.
n
r'
ph
Total lipid
30
0.90 ± 0.06
8
0.99
<.001
60
0.91 ± 0.16
7
0.94
<.001
150
0.99 ± 0.16
8
0.88
<.001
600
0.69 ± 0.19
8
0.89
<.001
All
0.79 ± 0.11
31
0.86
<.001
Protein
30
1.21 ± 0.12
8
0.98
<.001
60
1.16 ± 0.10
7
0.99
<.001
150
1.03 ± 0.03
7
0.99
<.001
600
1.1 I ± 0.20
8
0.99
<.001
All
1.04 ± 0.05
30
0.98
<.001
LMW
30
0.62 ± 0.36
8
0.68
.020
60
0.27 ± 0.16
7
0.68
.022
150
0.19 ± 0.02
7
0.42
.114
600
0.45 ± 0.12
8
0.91
<.001
All
0.40 ± 0.06
30
0.86
<.001
Polysaccharide
30
0.14 ± 0.32
8
0.14
.417
60
0.30 ± 0.18
7
0.69
.021
150
0.33 ± 0.22
7
0.68
J)20
600
0.22 ± 0.12
8
0.77
.012
All
0.21 ± 0.06
30
0.62
<.001
"Irradiance (fLmol photons m- 2 • s-') is for the light phase of the incubation.
hP' overall probability level for the regression model.
correlation, because the T2 value has to depend at least partly on the Tl value, but
it does show that overnight reallocation is not large enough to prevent useful
predictions of diel lipid synthesis from measurements over the light phase only.
The slope of the relationship was significantly less than unity (0.79). Regressions
for each irradiance level separately also indicated both high degrees of correlation
and slopes equal to or less than unity (although not always significantly, as judged
by the confidence intervals for the slopes; Table 3.2). The apparent loss of new
lipid overnight was maximal at the highest and lowest irradiances.
Is the high predictability of diel synthesis from the light-phase synthesis a
feature of lipids only, or might it apply to other photosynthate classes? The mass
of new, labeled, protein at T2 was highly predictable from the mass at Tl (Table
3.2) and indicated a very modest overnight net synthesis of protein from recently
acquired photosynthate. The T2 masses of LMW and polysaccharide were less
predictable than for lipid or protein (Table 3.2), apparently reflecting a substantial
variability in respiratory and other losses overnight.
3.2.3. Budgets for Overnight Activity
Budgets based on models for overnight reallocation In some marine phytoplankton communities have been elegantly elucidated by Lancelot and Mathot